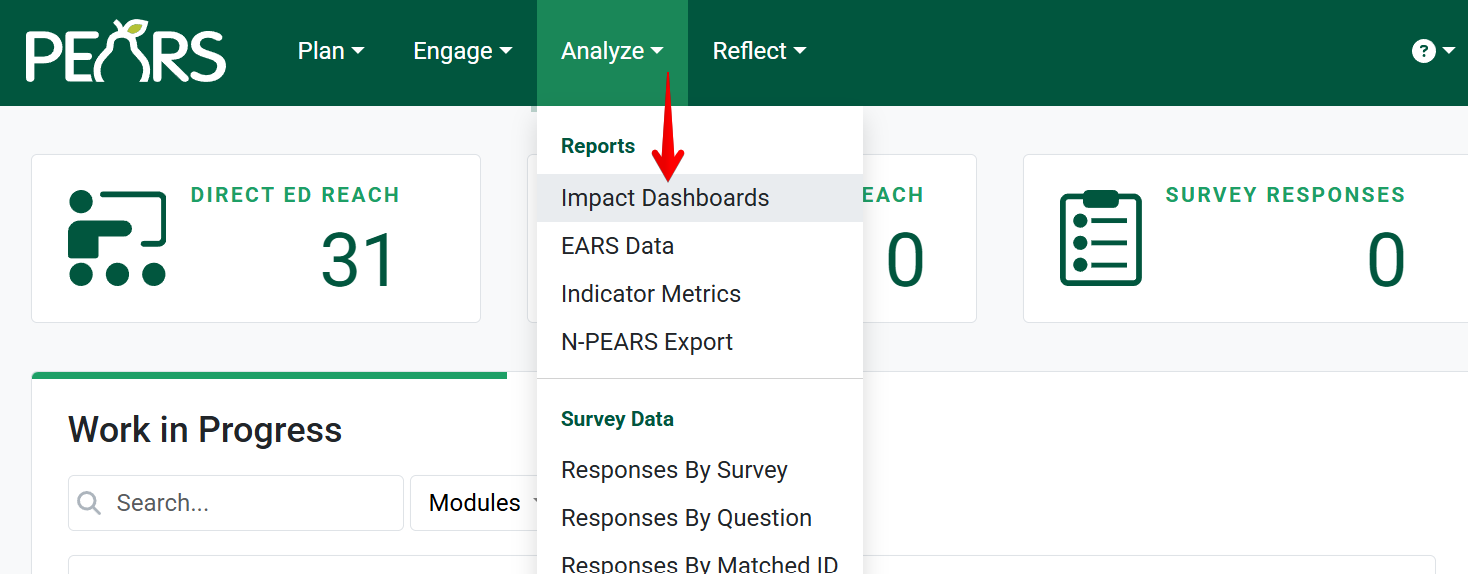
From the PEARS homepage, hover the cursor over the Analyze menu and click Impact Dashboards.
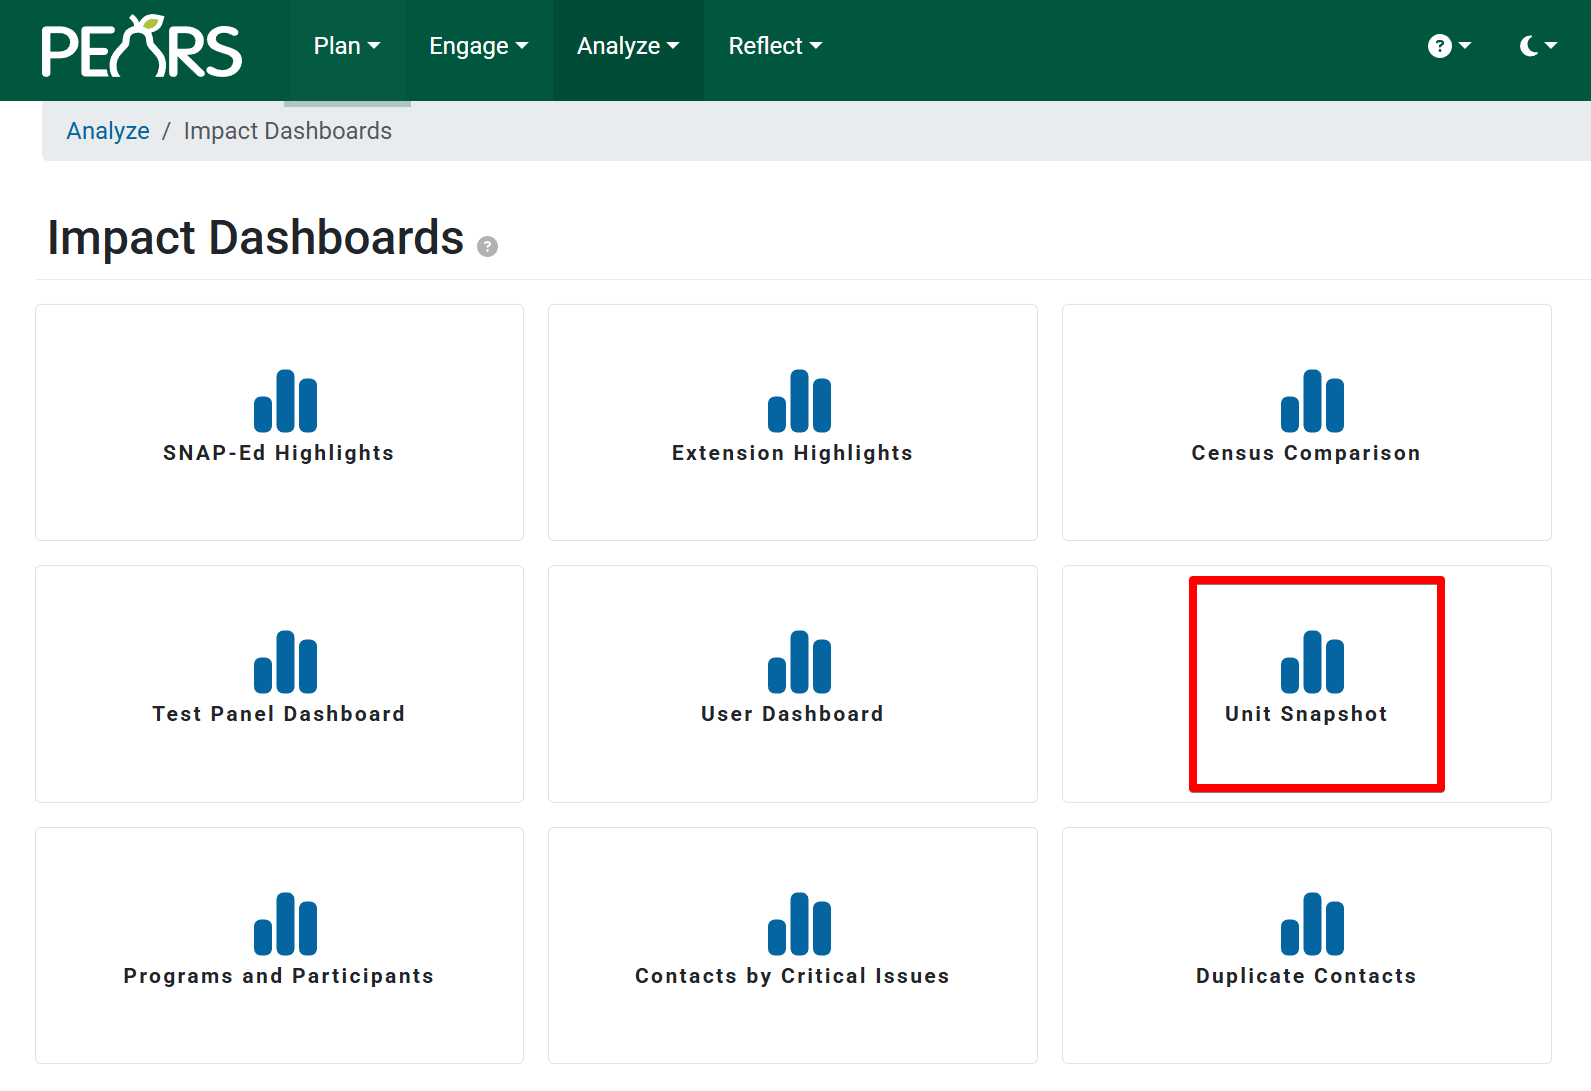
Impact Dashboards will display the reports that can be accessed in PEARS. Select Unit Snapshot.
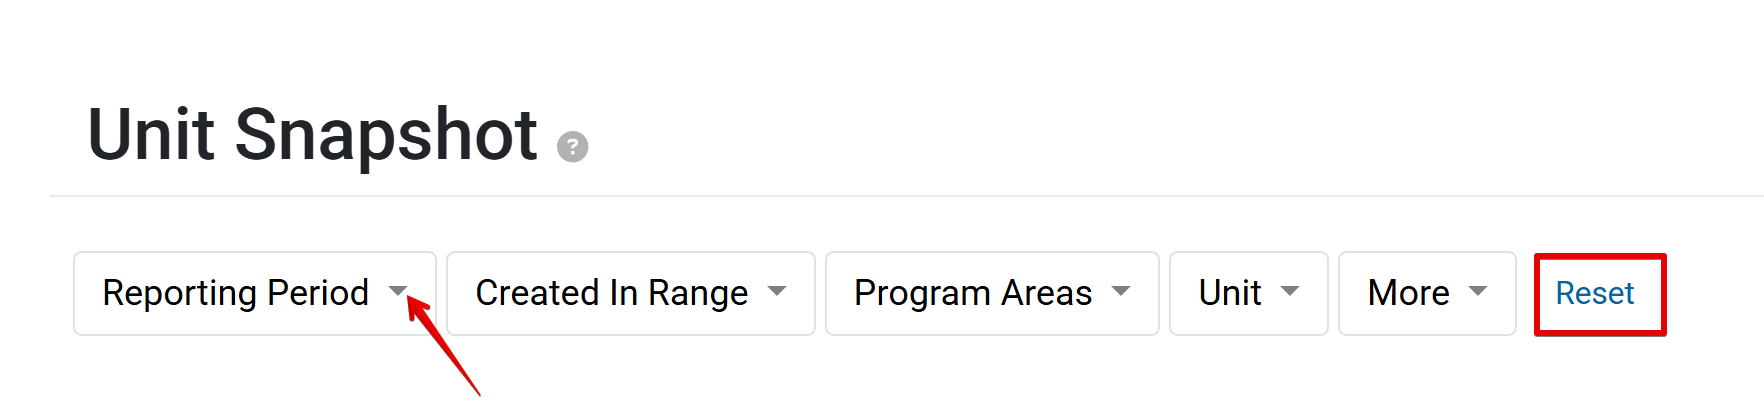
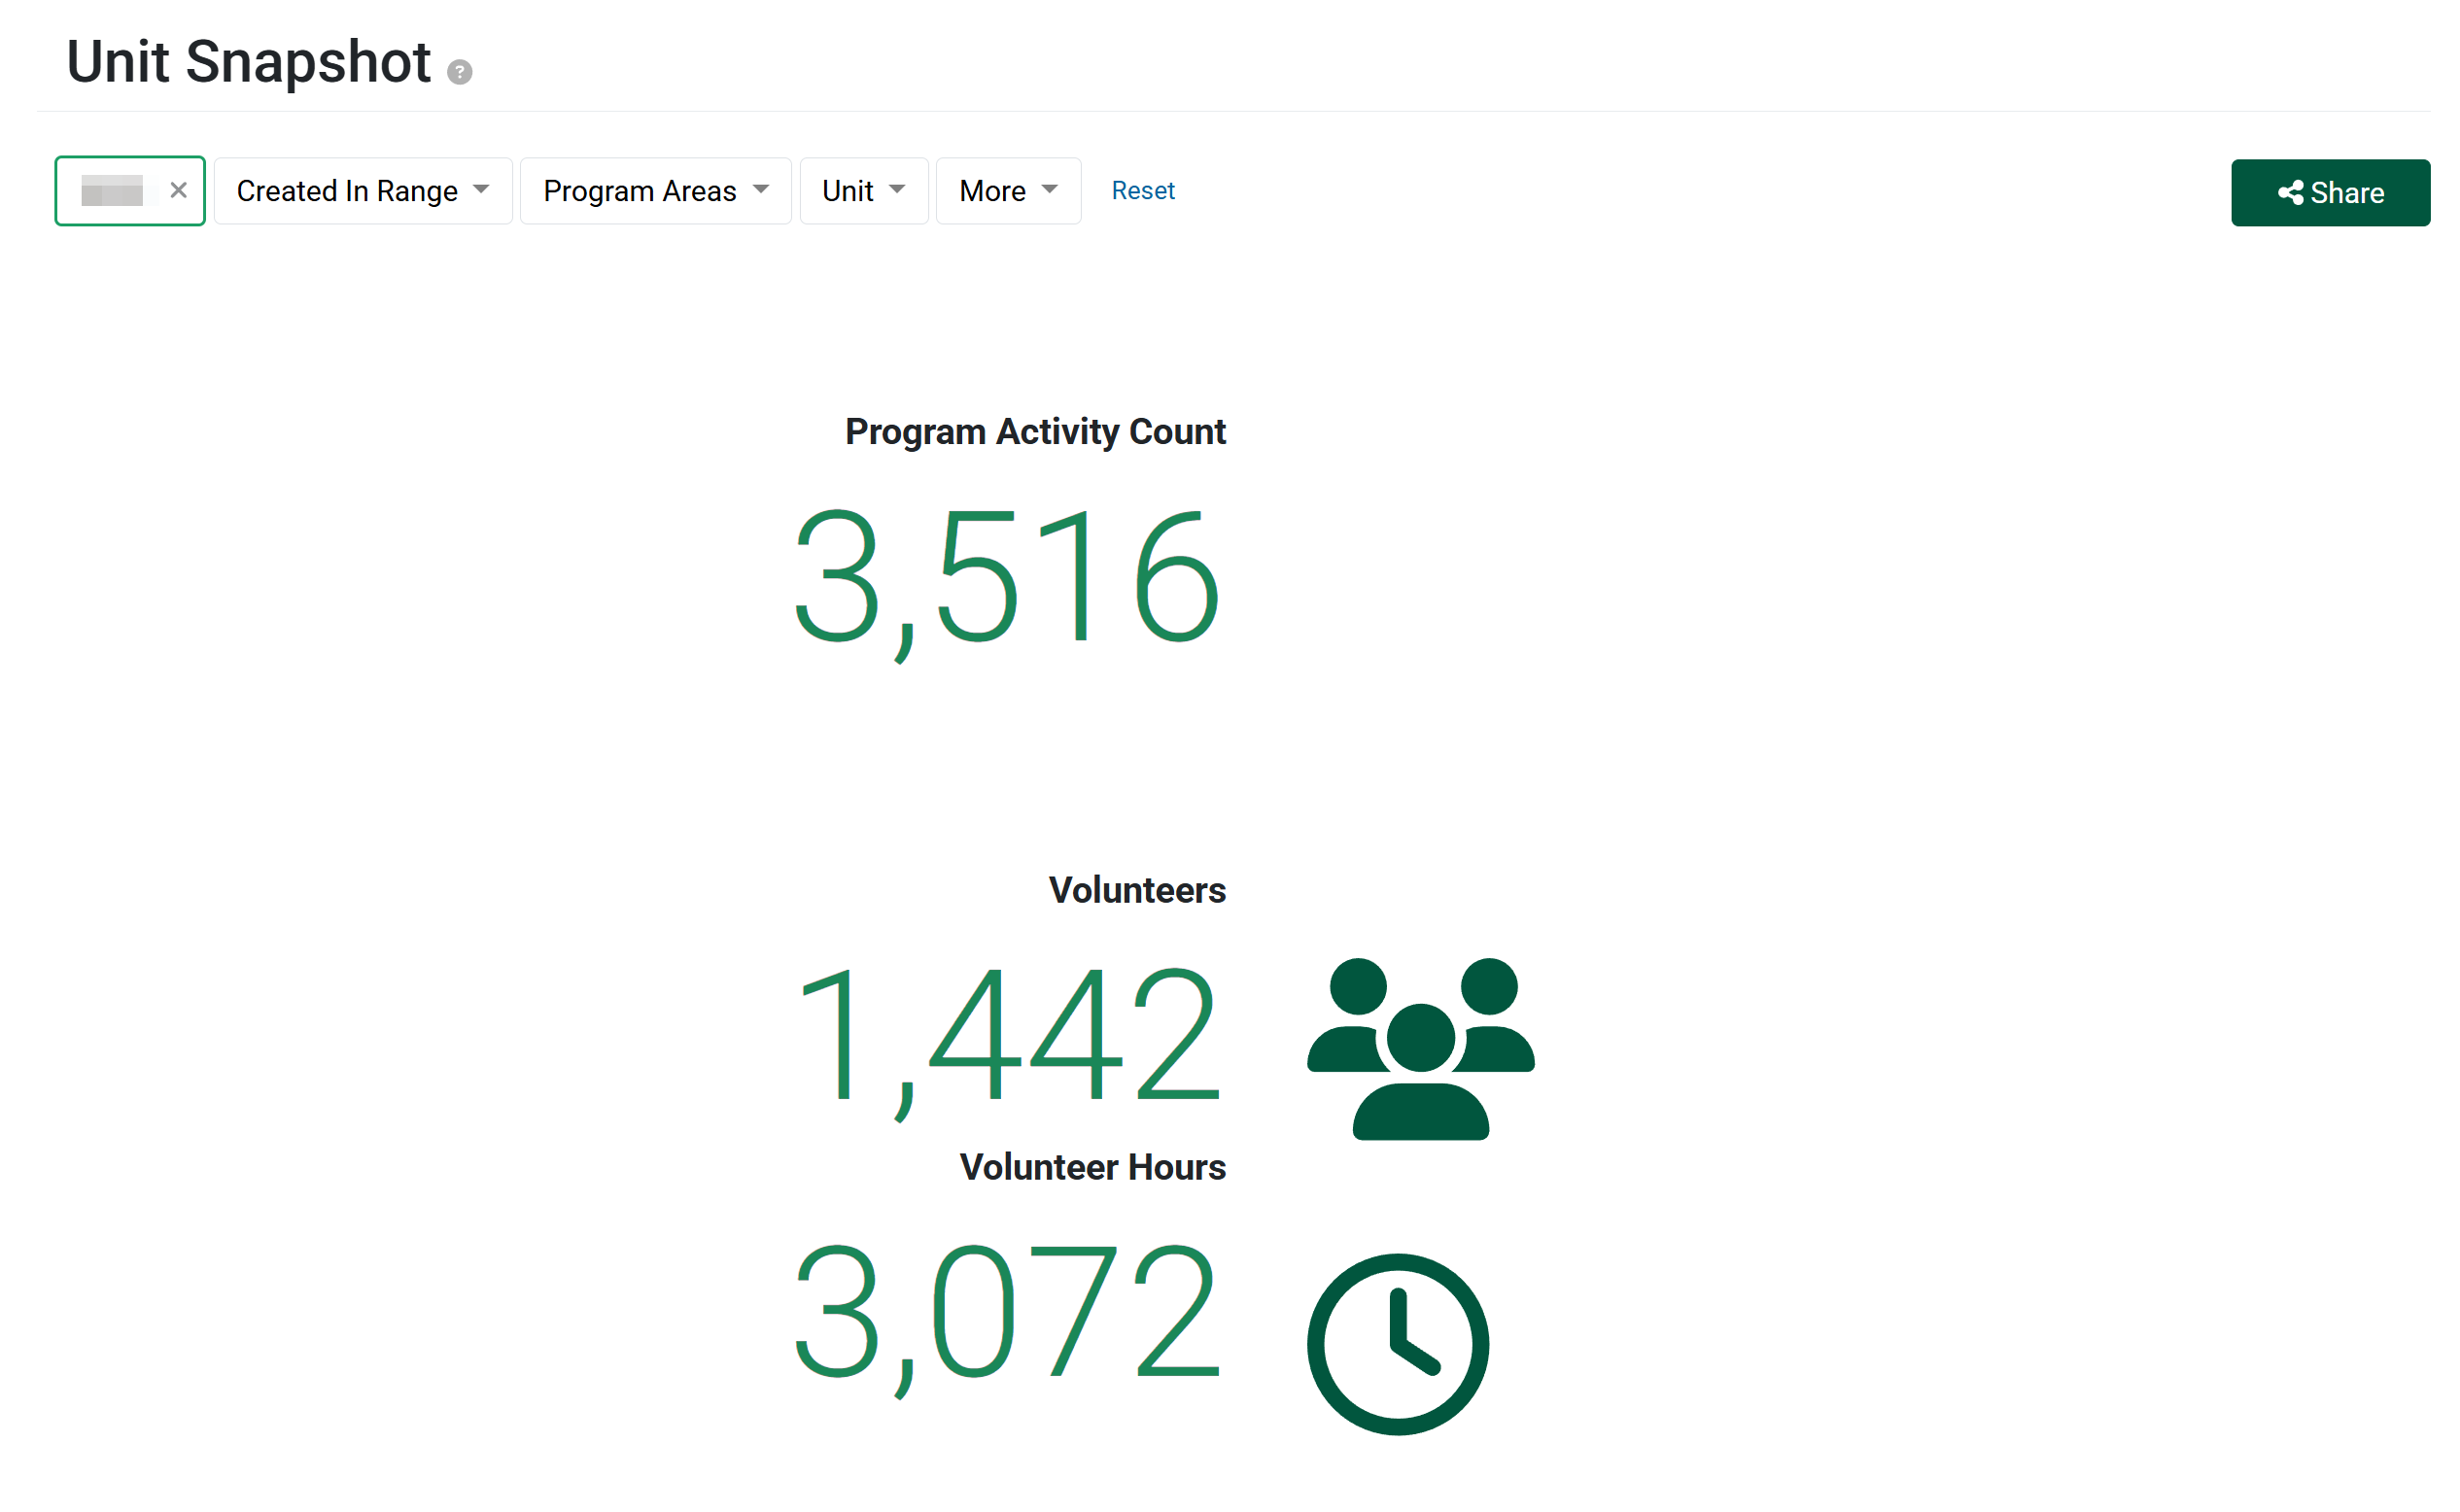
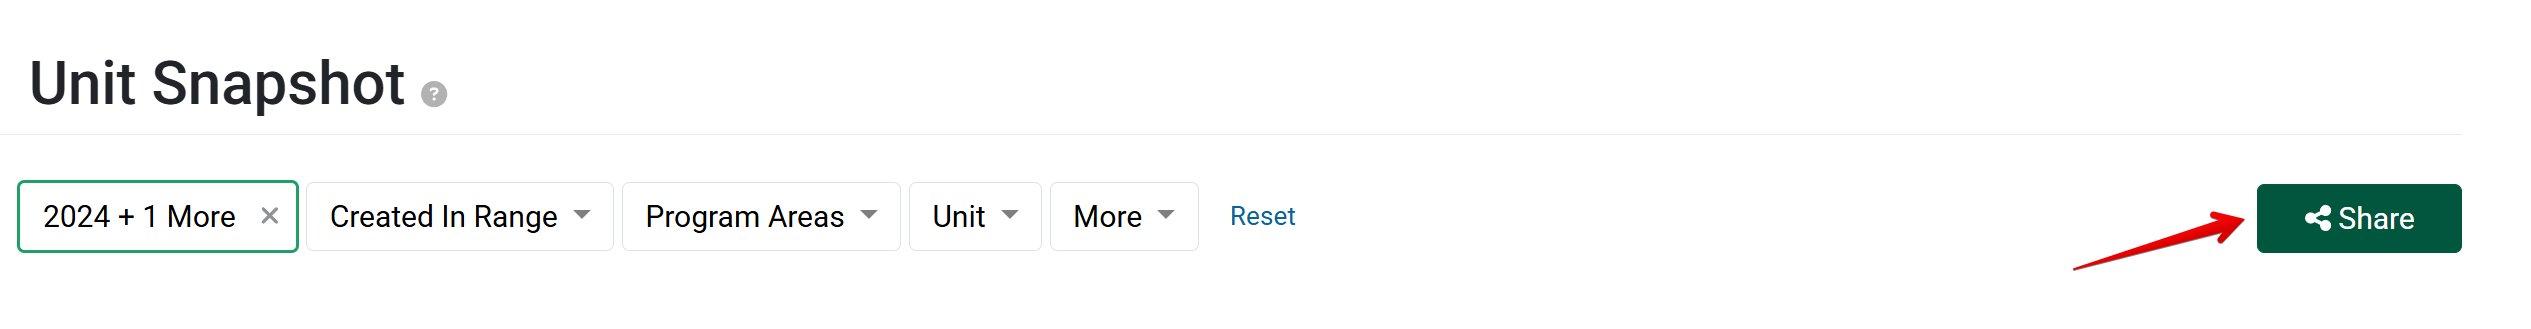
By default, the Unit Snapshot report does not have any filters applied. Click the dropdown menu on each filter to select desired data. Filtering options include Reporting Period, Created in Range, Program Area, Unit, and More. The Reset option returns the filters to the default setting.
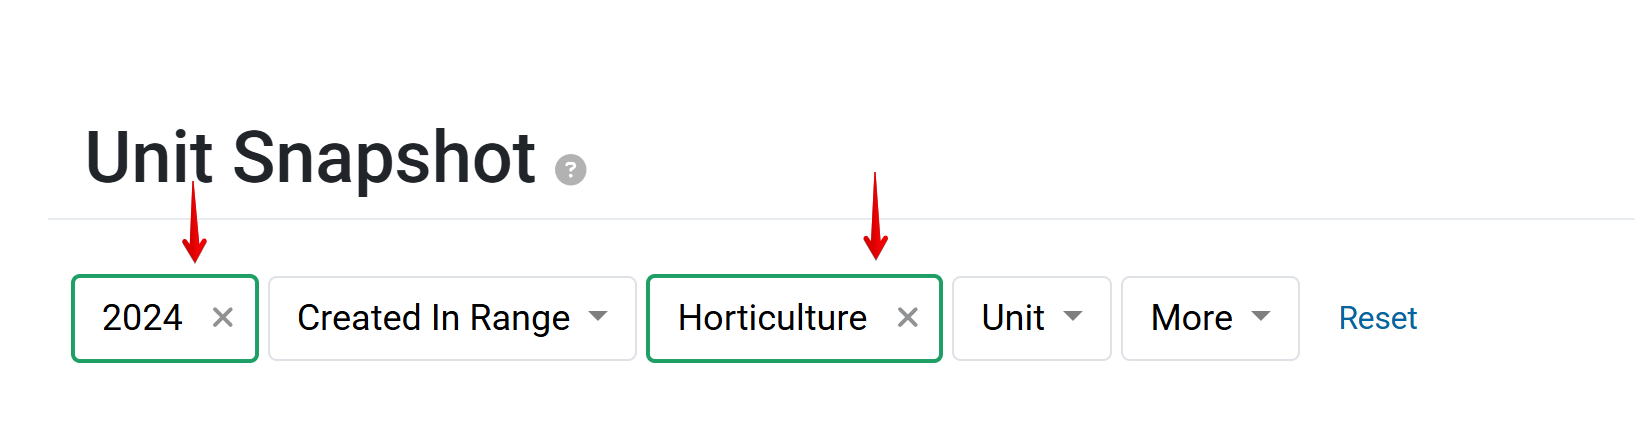
Options will display under each filter. In this example, the Unit Snapshot has been filtered to display Program Area data in Horticulture during the 2024 reporting year. Filtered fields will be highlighted by a green box.
The Unit Snapshot report includes five sections that can be viewed by scrolling down the dashboard page.
The first section displays the Program Activity Count, Volunteers, and Volunteer Hours that correspond to the selected filter criteria.
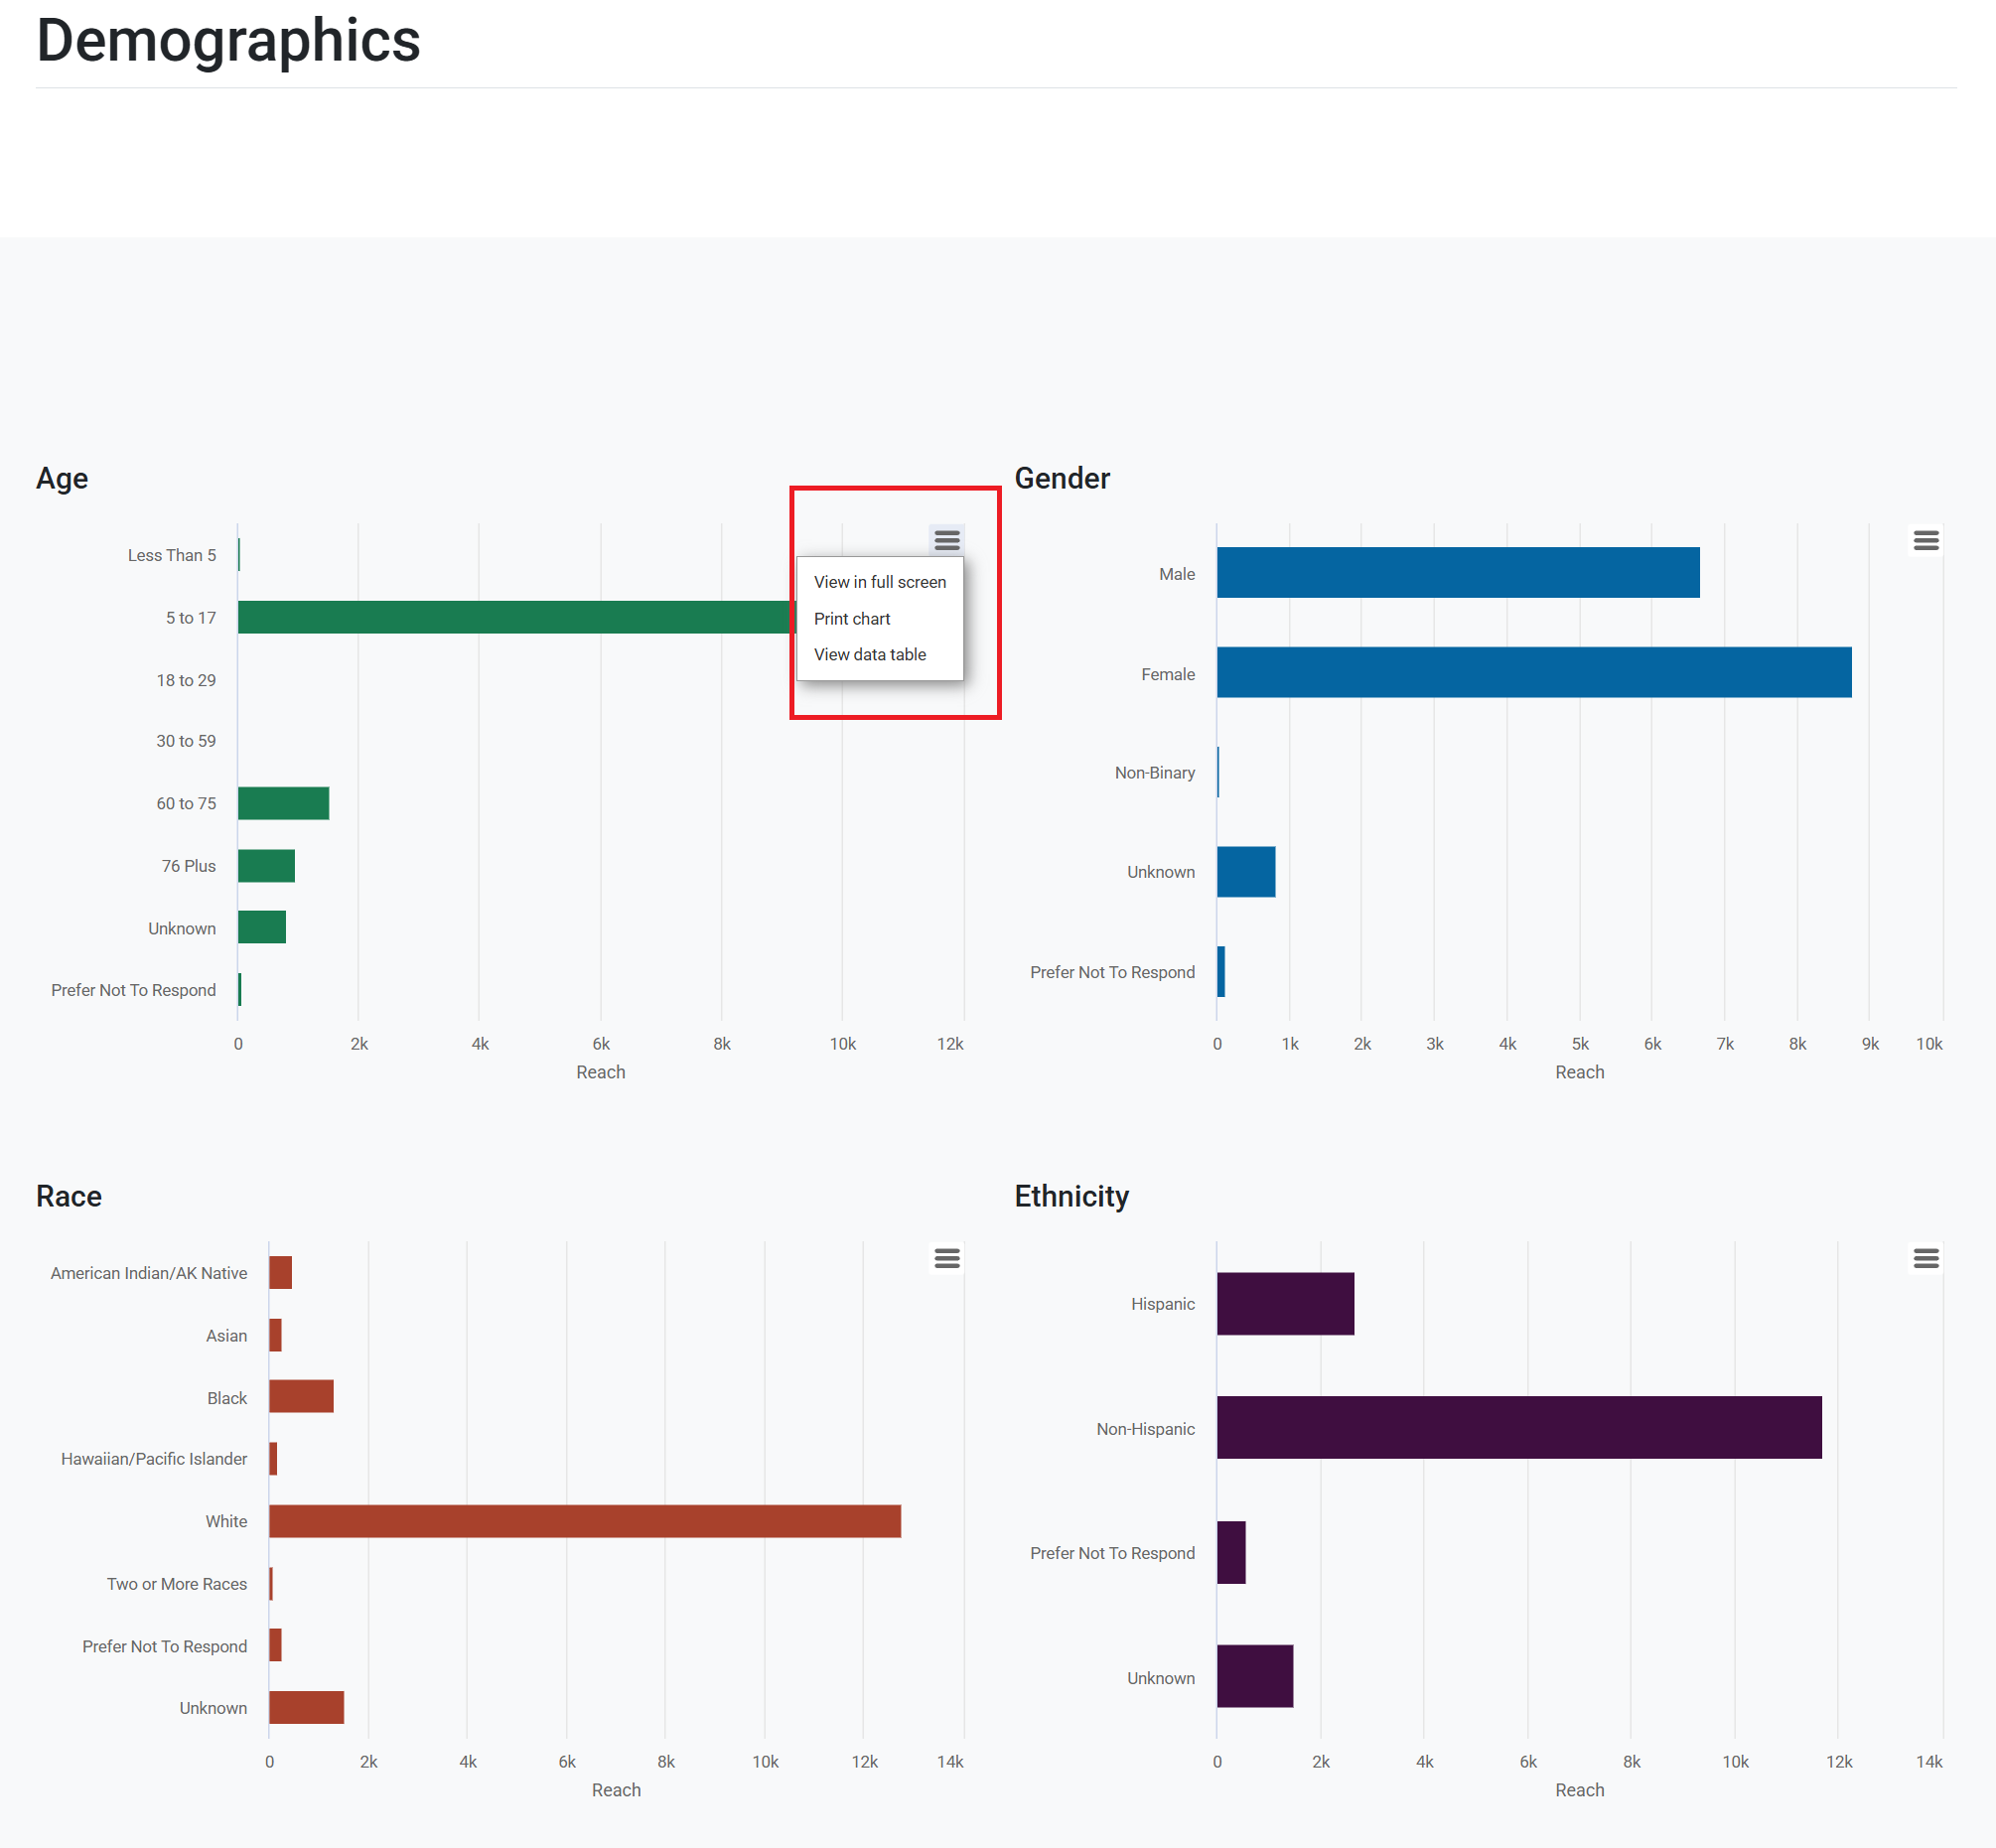
Demographics displays data by age, gender, race and ethnicity that correspond to the selected filter criteria. Hover over each bar chart to view a count of participants. Click the hamburger icon on each chart for additional display options, such as view in full screen, print chart, and view data table.
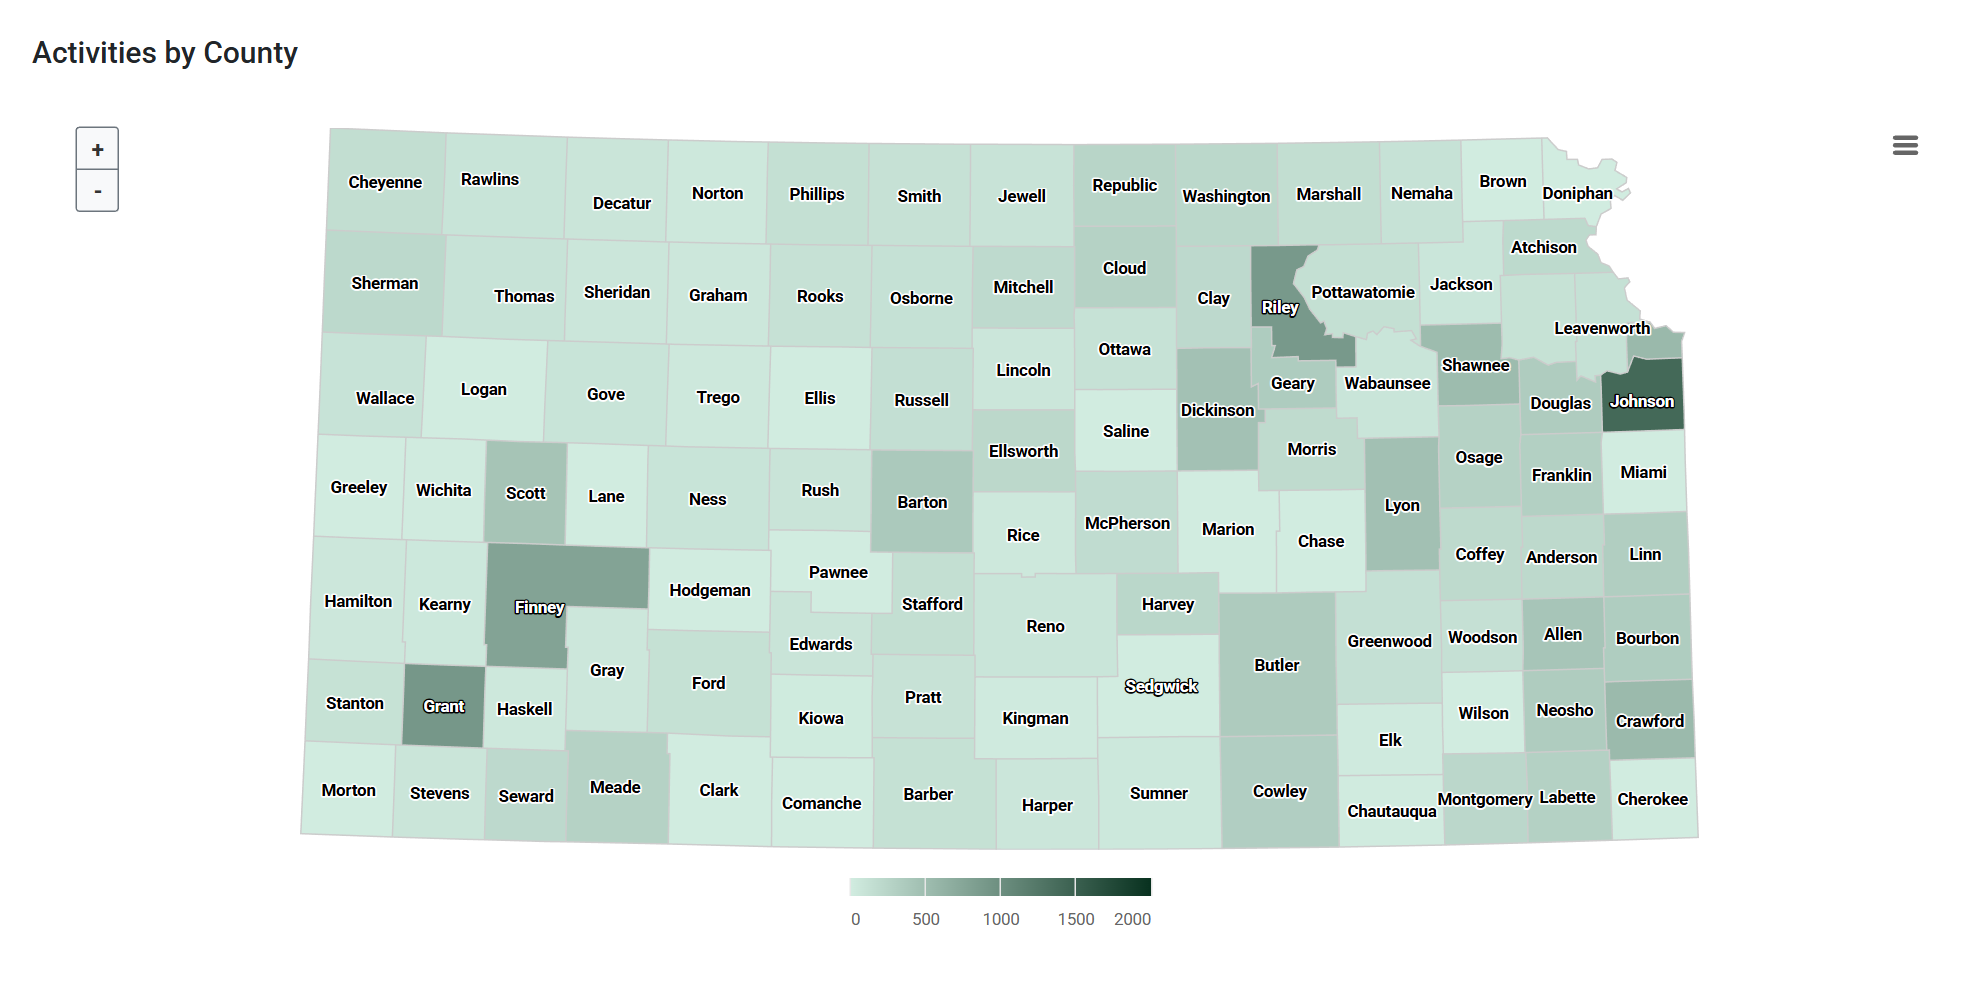
Activities by County displays the number of Program Activities delivered per county. Hover over a county to view a count of Program Activities. Data is shown for activities that correspond to the selected filter criteria.
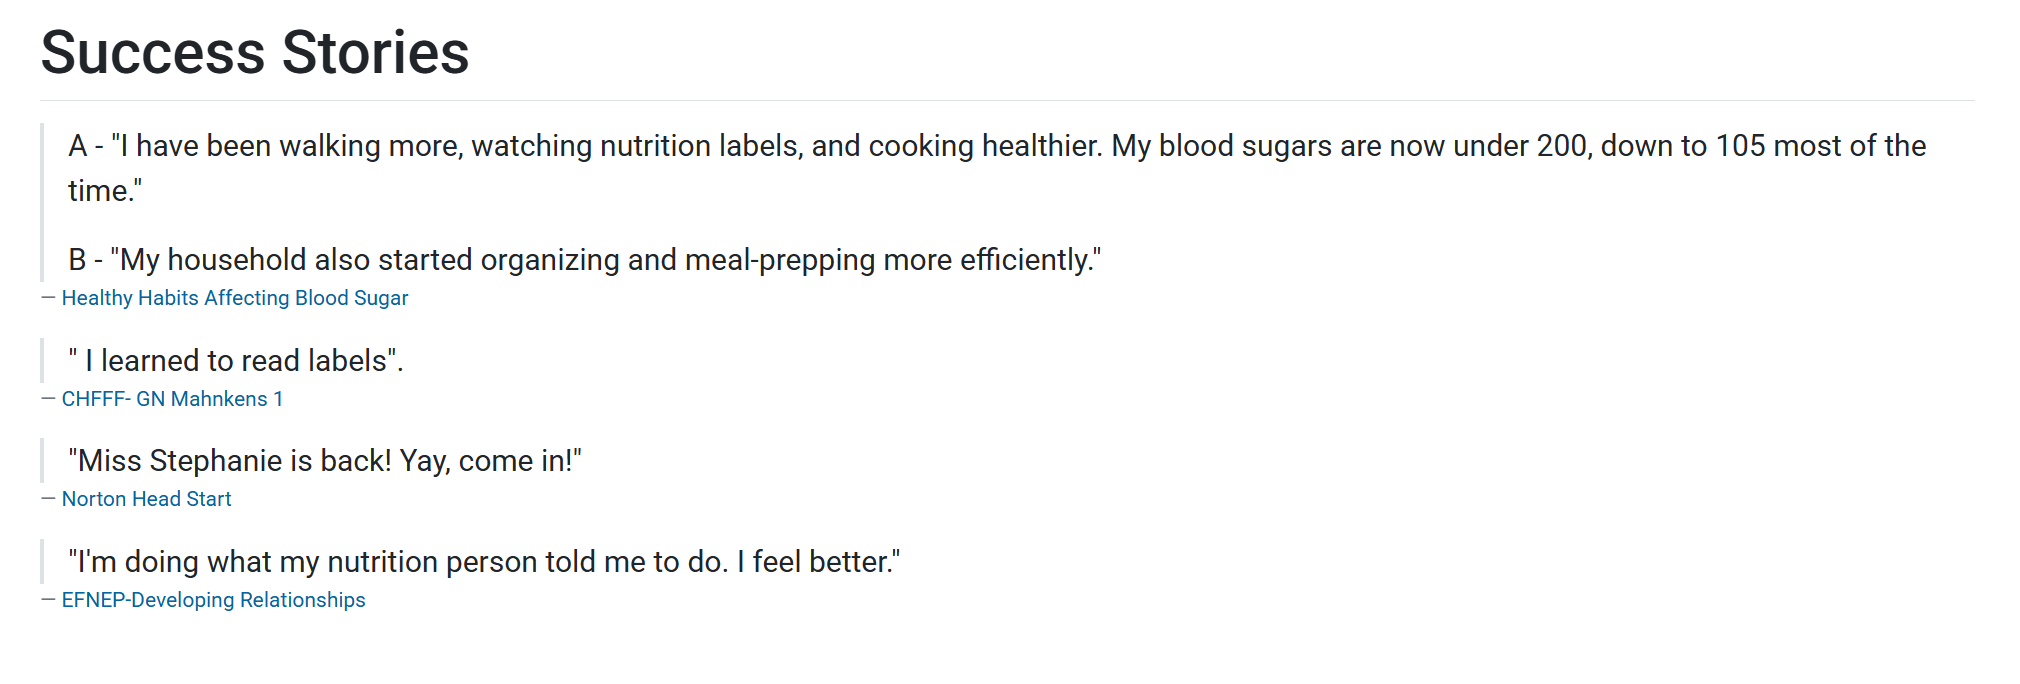
Success Stories lists quotes from the Success Stories module. The quotes are randomly selected from Success Stories based on the selected filter criteria.
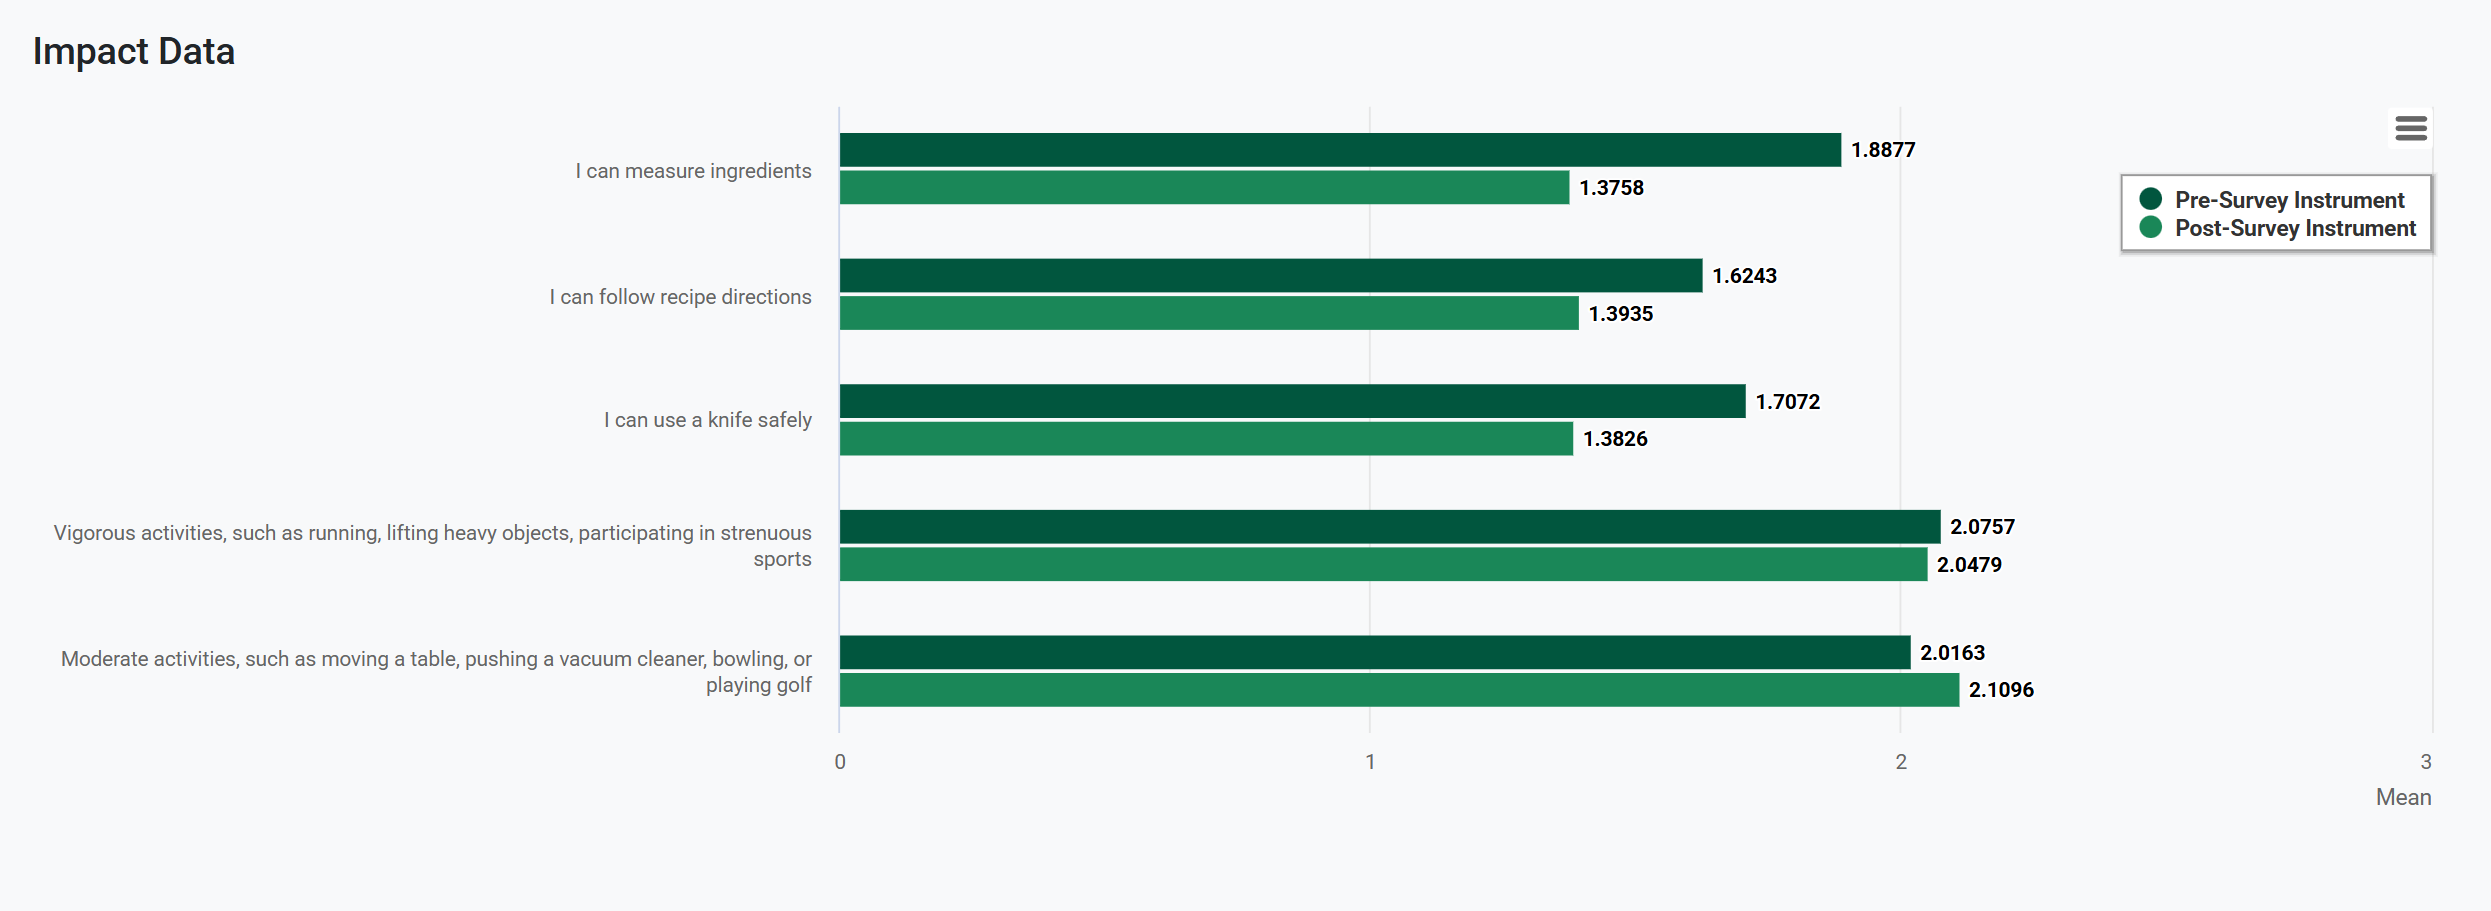
Impact Data compares the mean of pre and post survey questions with the most responses. Hover over each section of the bar graph to view a count of participants. Data is shown for activities that correspond to the selected filter criteria.
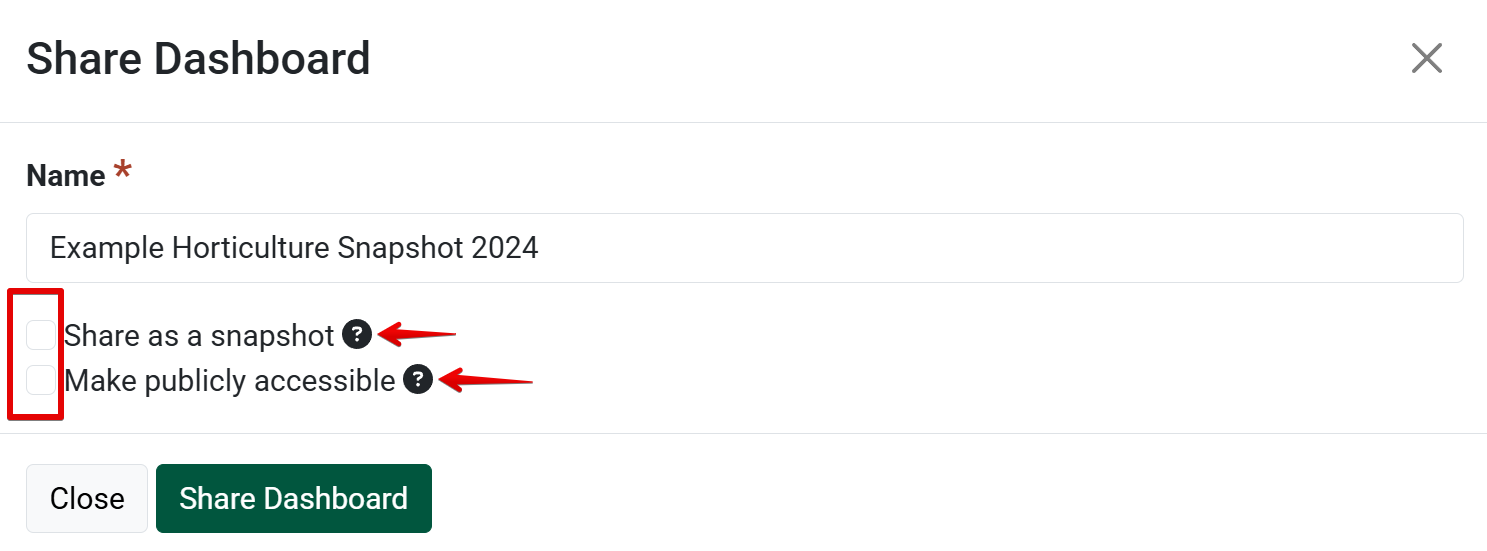
To share the Unit Snapshot report, filter by desired criteria and click the Share button. A dialogue box with sharing options will open. Naming the report is required. There are two checkbox options for sharing: Share as a Snapshot and Make Publicly Accessible. Hover over each question mark to see more detail about each sharing option. One, or both, checkboxes may be selected.
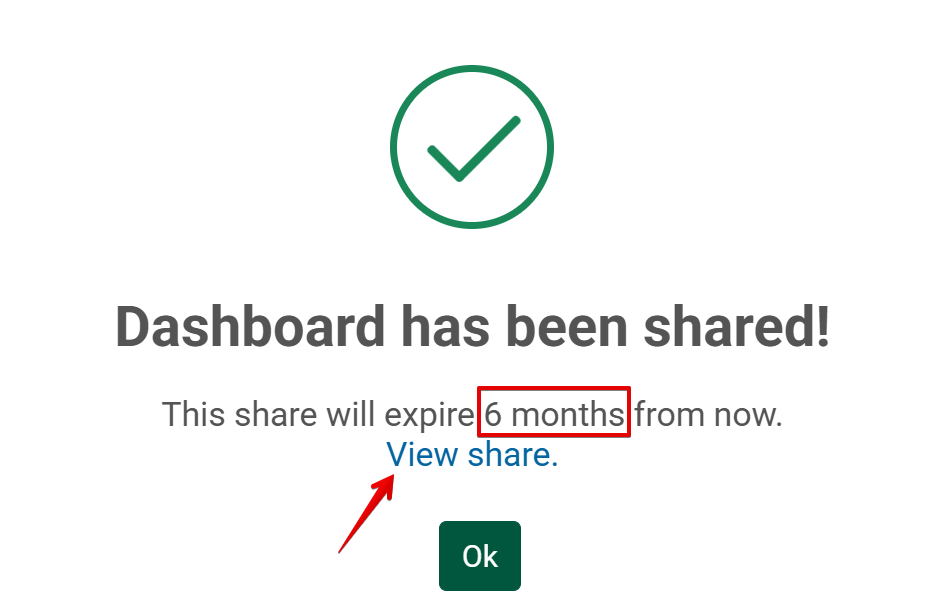
After selecting desired share options, a confirmation message will appear. Click View Share to see the details of your shared report and corresponding QR code to be shared. Selecting Ok will return you to the Unit Snapshot page.
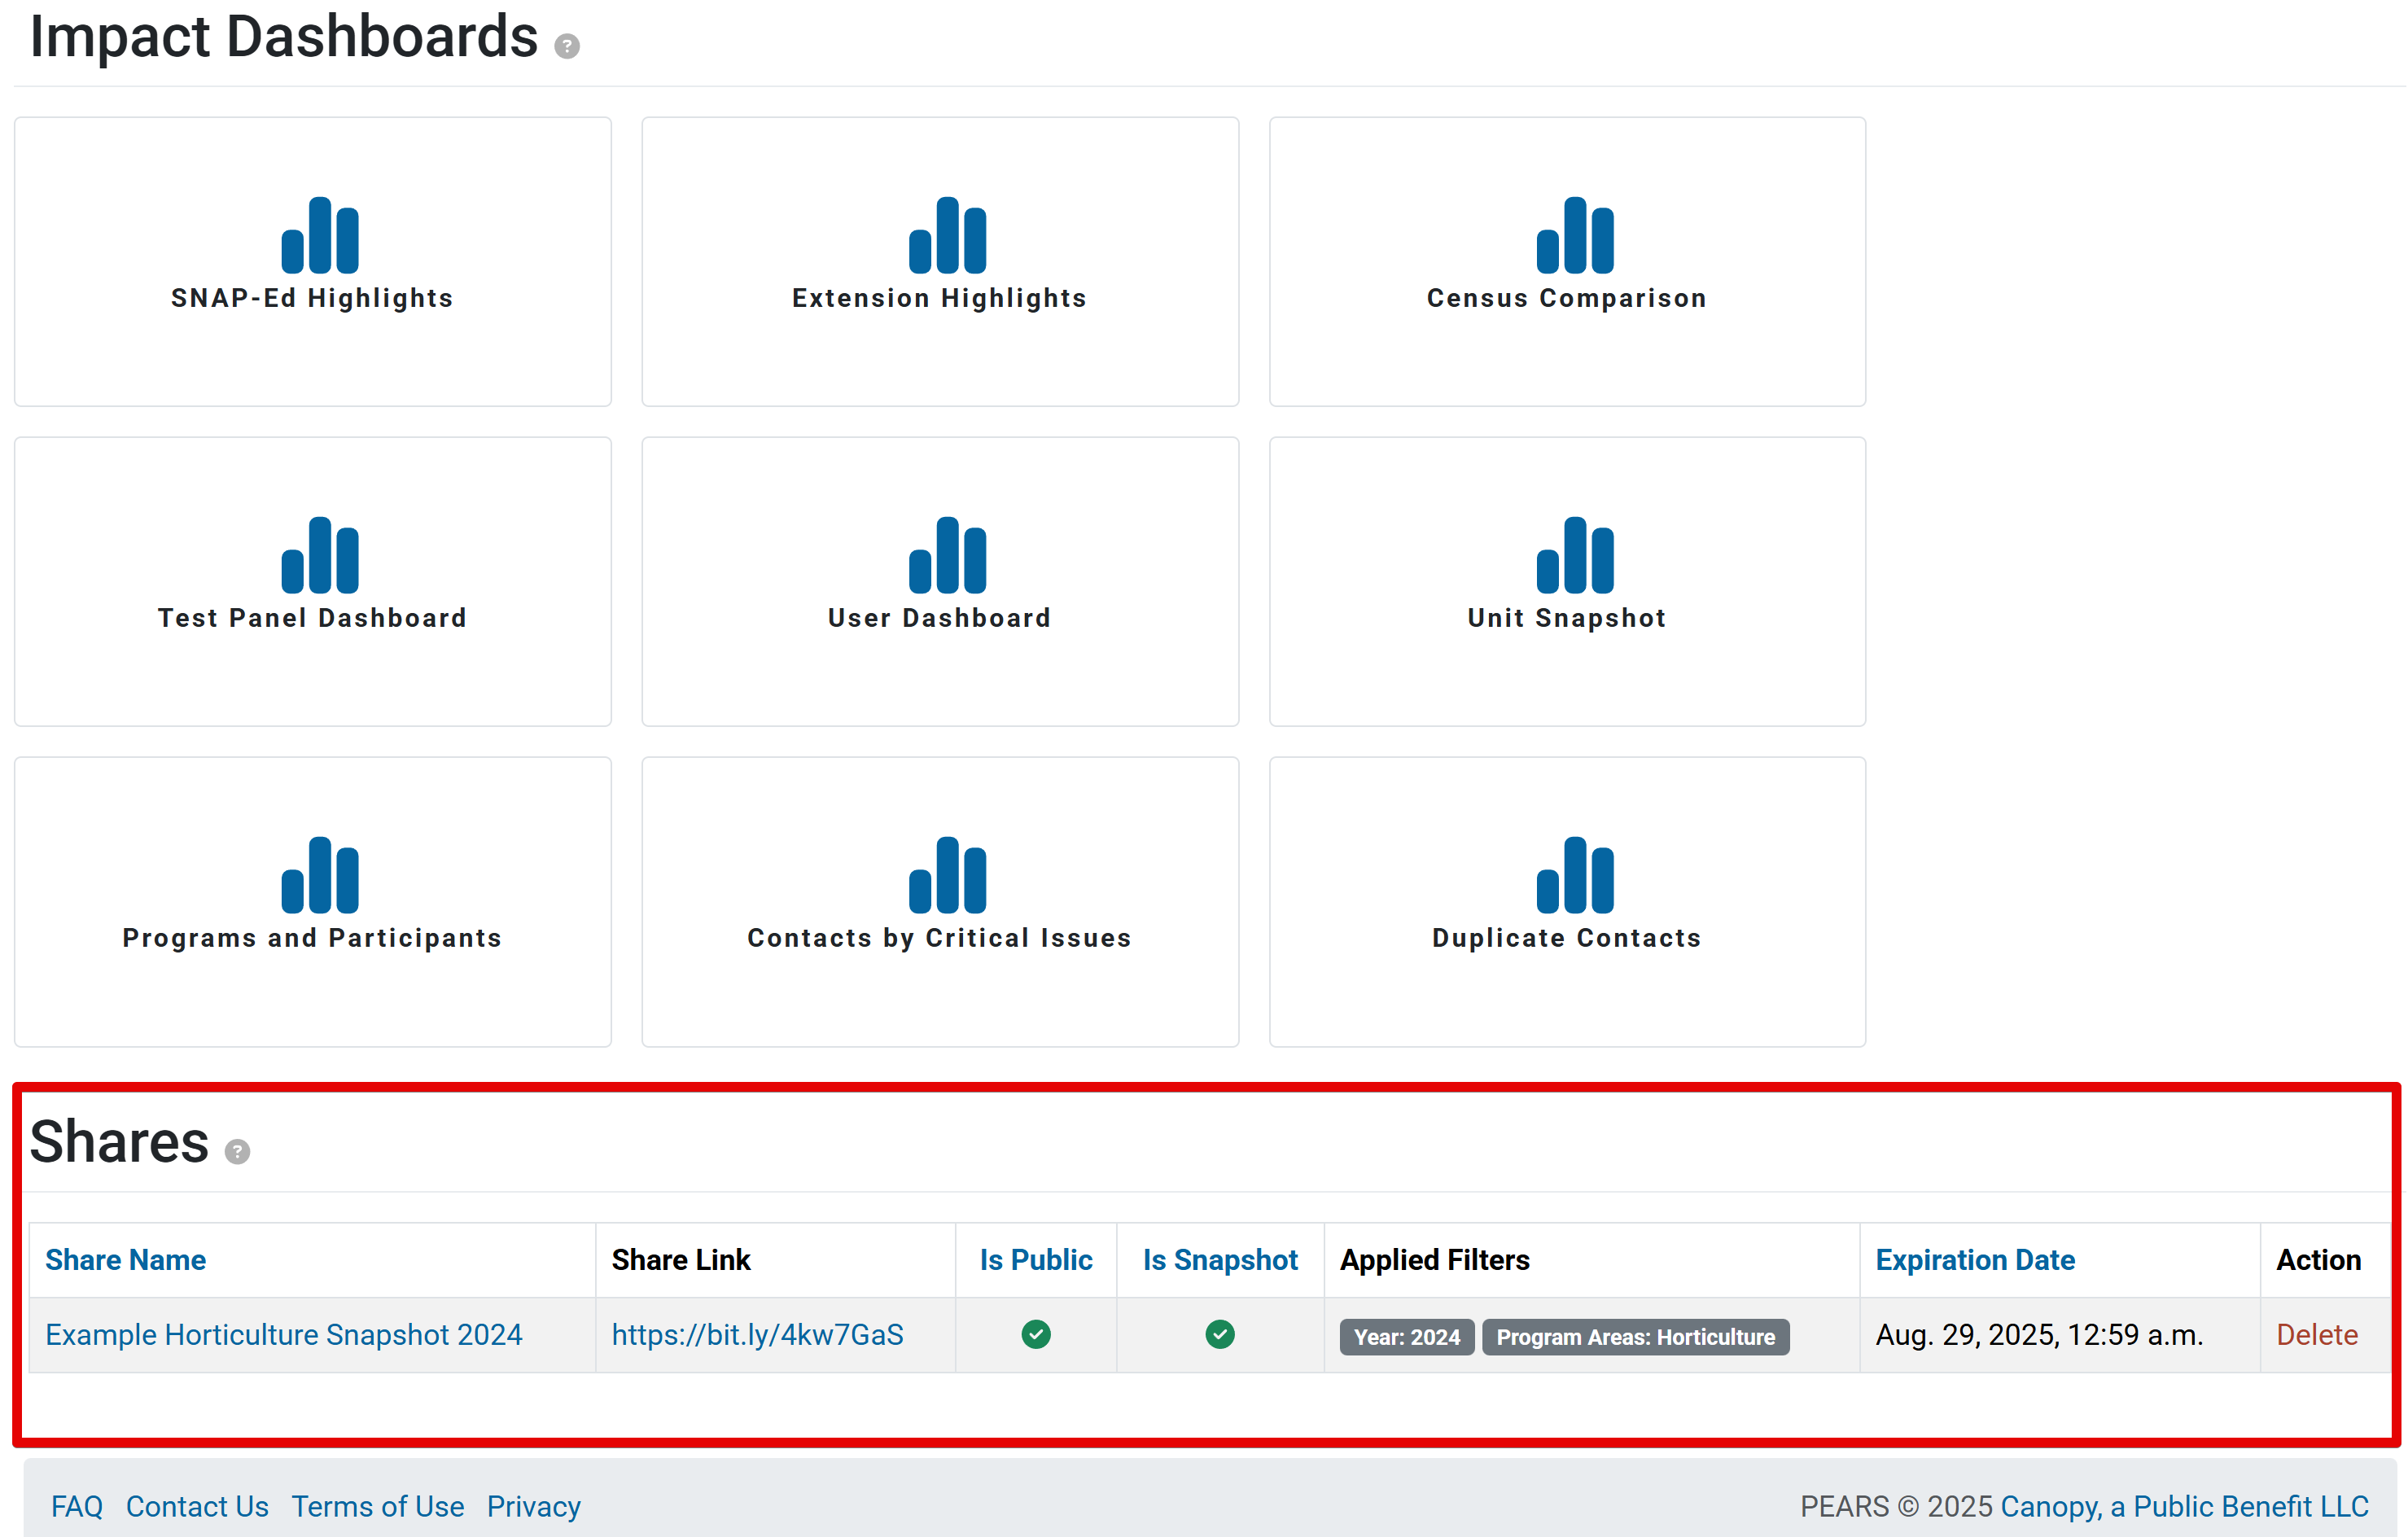
To see a current list of shared reports, navigate from the Analyze menu to Impact Dashboards. A list of shared reports will populate below the Impact Dashboard tiles. Details of the shared report include the name, a sharable link, public and snapshot selection criteria, applied filters, shared report expiration date, and the option to delete the shared report.