- From the PEARS homepage, hover the cursor over the Analyze menu and click Program Activities and Participants.
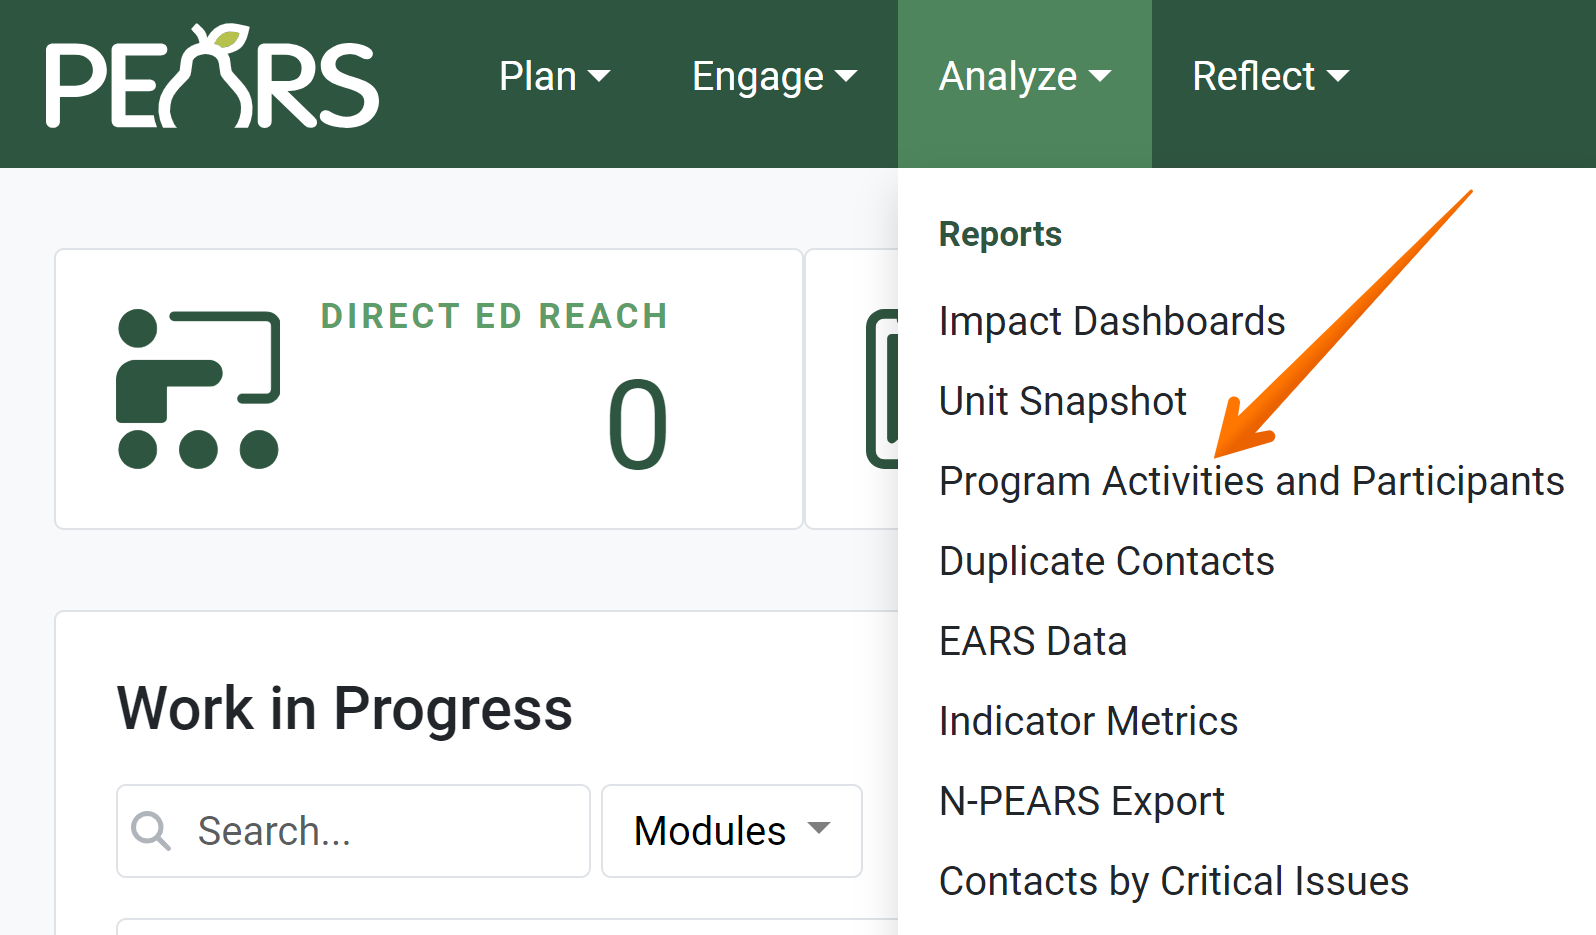
- The Program Activities and Participants report displays.

- By default, the report is filtered to show data from completed records during the past year (based on the date the report is accessed, not the fiscal year). Click the Filter button to change the default filters.

- Filter options display. Change the filter criteria as needed to display the desired set of data.

- To change the date range, select a new Start Date and/or End Date. Click the date field, then select a date from the calendar.

- To include incomplete records, click the checkbox.

- Click Apply to confirm the selected filters. The chart and table show data based on applied filters.

The Program Activities and Participants report includes a chart and a table showing the number of Program Activities and participants for each program area.
- A chart depicts the number of Program Activities delivered for each program area and the number of participants for each program area.

- A table lists the number of Program Activities delivered for each program area and the number of participants for each program area.

- To save the chart, click the chart menu.

- Select an option from the list to print the chart, save as a PDF, or save as an image.

- To print or save the table, please reference the following article: Save or Print a Record as a PDF.