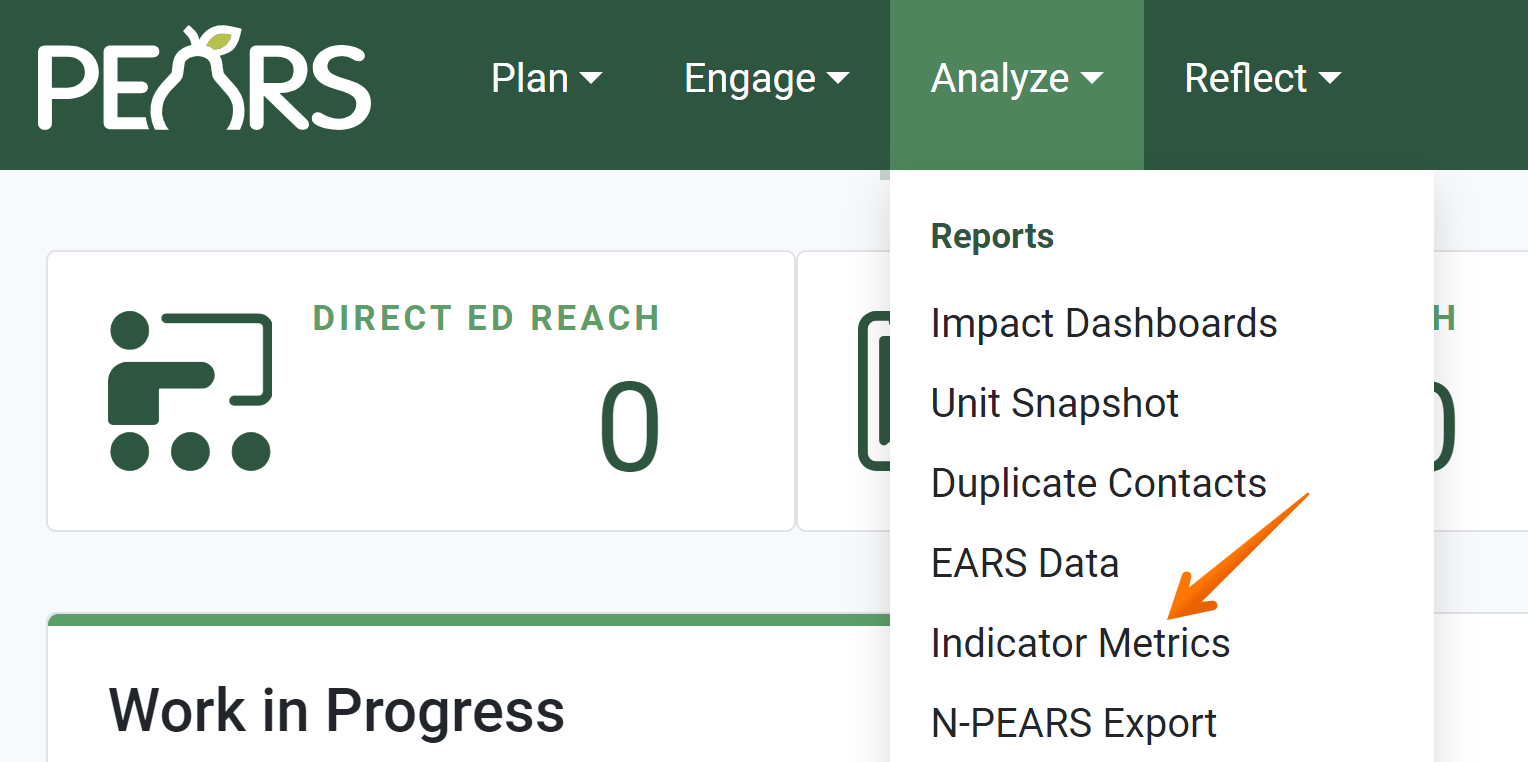
- From the PEARS homepage, hover the cursor over the Analyze menu and click Indicator Metrics.
- The Indicator Metrics report page displays:

- By default, the Indicator Metrics report is filtered to show data from completed records within the entire state created during the current reporting year. Click Edit Filters to change the default filters.

- Filter options display. Change the filter criteria as needed to display the desired set of data.

- Click Apply to confirm the selected filters. Once an indicator is selected, data will be displayed based on the applied filters.

- The applied filters are listed under the Filters heading. For example, the User, Unit, Reporting Year, and Include incomplete filters are displayed here:

The Indicator Metrics report includes data for the indicators and corresponding metrics listed below. Unique report items will display for each indicator and metric selected.
- To view the report for a metric, first select an indicator from the list.

- A tab displays for each metric. Select a metric to view the report.

- To order a report by a specific column, click on the heading of the column once to list items in ascending order (1-10, a-z). Click the heading again to sort items in descending order (10-1, z-a). The example below is sorted by the first column, in descending order. A small arrow indicates which column the data is sorted by.

Indicators and Metrics:
ST5: Readiness and Need
Metrics: ST5a, ST5b, and ST5cST7: Organizational Partnerships
Metrics: ST7a, ST7b, ST7cST8: Multi-Sector Partnerships and Planning
Metrics: ST8a, ST8b, ST8c, ST8dMT5: Nutrition Supports
Metrics: MT5a, MT5b, MT5c, MT5d, MT5e, MT5fMT6: Physical Activity and Reduced Sedentary Behavior Supports
Metrics: MT6a, MT6b, MT6c, MT6d, MT6eMT12: Social Marketing
Metrics: MT12a, MT12b, MT12cLT5: Nutrition Supports Implementation
Metrics: LT5a, LT5b, LT5cLT6: Physical Activity Supports Implementation
Metrics: LT6a, LT6b, LT6cLT7: Program Recognition
Metrics: LT7a, LT7b, LT7c, LT7dLT8: Media Coverage
Metrics: LT8a, LT8b, LT8cLT10: Planned Sustainability
LT10a