Impact Dashboards visually display SNAP-Ed and Extension efforts through a series of eye-catching charts and graphs. Dashboards are accessible to all PEARS users. Viewable data is determined by account permissions.
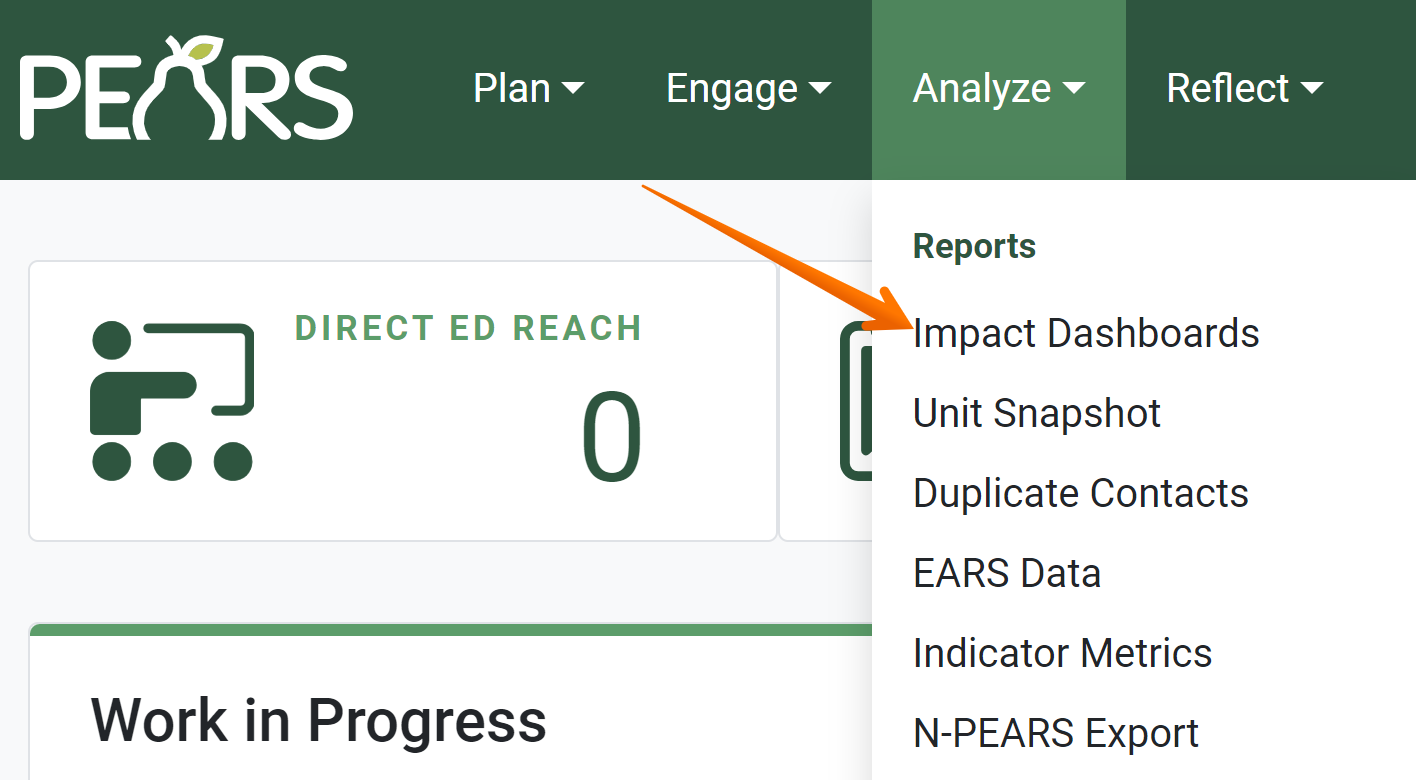
From the PEARS homepage, hover the cursor over the Analyze menu and click Impact Dashboards.

Dashboard options display. Select a dashboard to view.

A series of panels displays data on: Direct Education (Program Activities), Indirect Activities, Partnerships, and Coalitions. SNAP-Ed dashboards also display PSE data.
By default, no filters are applied to the data. All data that you have access to view, from all reporting years, is shown. Use the filter categories listed at the top of the page to filter for more specific sets of data.

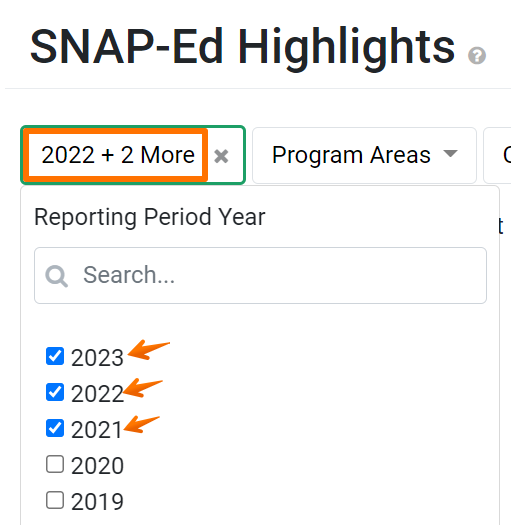
Most filter categories allow more than one selection.

Once a filter option is selected, data shown in the dashboard panels automatically updates to reflect the selected filters.
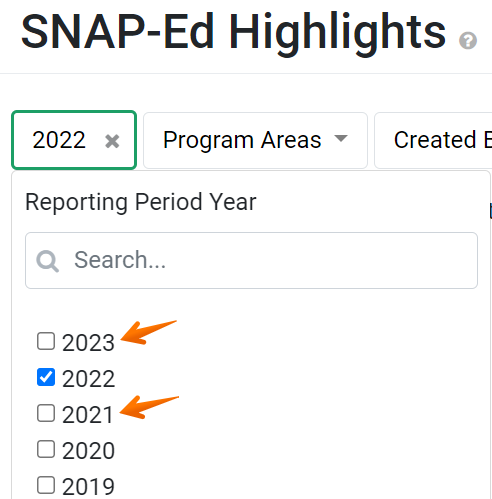
To remove filter(s), deselect options within a filter.

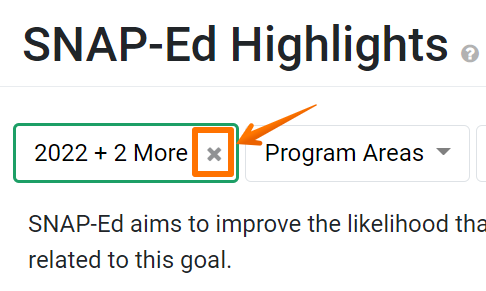
To remove all options selected within a filter, click the x to the right of the filter name.

EXAMPLE:
By default, users only have permission to view their own records and related data. Additional permissions may be added, such as viewing data for a specific unit or program area. Some staff are given permission to view/edit data for another user. Data Managers can view all data within their organization.
NOTE:
SNAP-Ed and Extension data can be filtered based on: reporting period(s), program area(s), user(s), unit(s), site(s), intervention(s), setting(s), and complete/incomplete records.
The SNAP-Ed dashboard allows data to be filtered by intervention(s)
The Extension dashboard allows data to be filtered by Action Plan.
The SNAP-Ed dashboard allows data to be filtered by intervention(s)
The Extension dashboard allows data to be filtered by Action Plan.
NOTE:
The Action Plans and Complete filter categories only allow one option to be selected.
✓ TIP:
If none of your viewable records match the filters applied, data cannot be displayed. For numeric data (such as number of volunteers), a 0 will display. For charts and graphs, you may see the following messages:
• "There is not enough data to display this chart."
• "This chart cannot be filtered by the following filters: _______"
• "There is not enough data to display this chart."
• "This chart cannot be filtered by the following filters: _______"