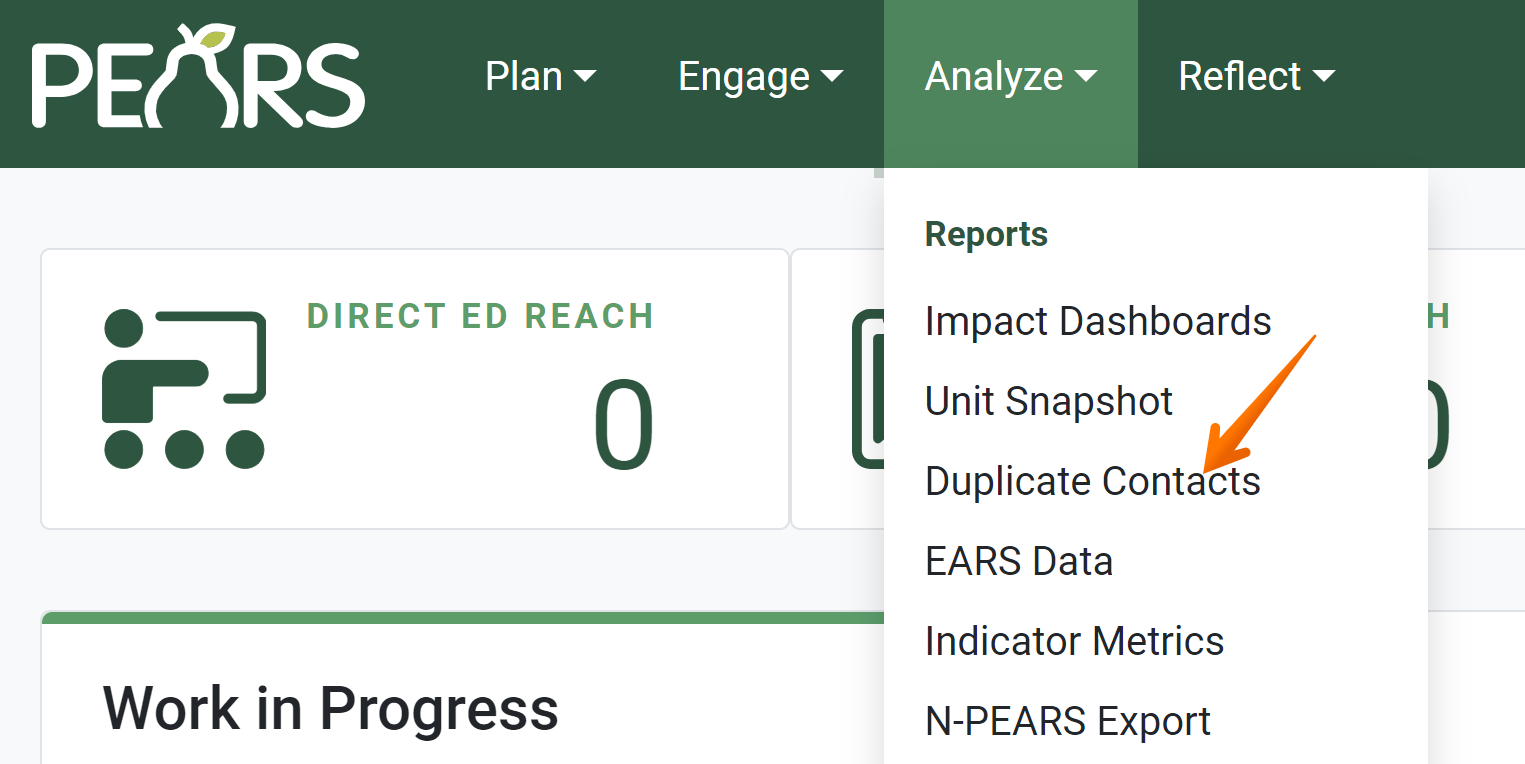
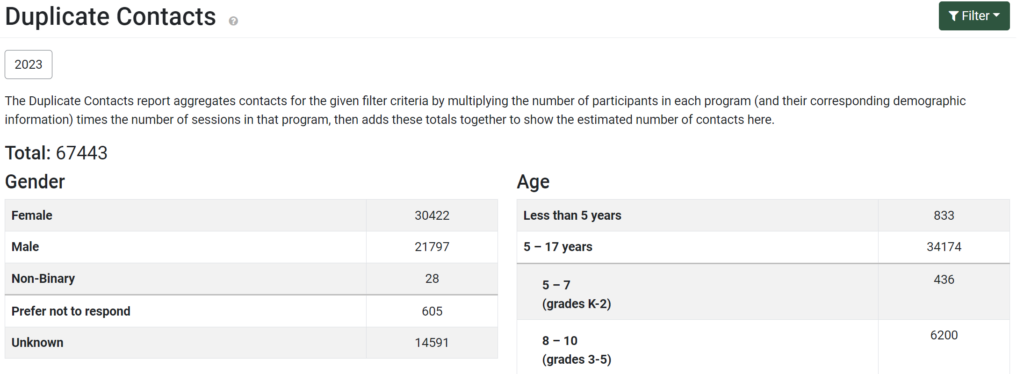
The Duplicate Contacts report shows the duplicated number of participants recorded in Program Activities, for given filter criteria. This means that totals are based on the number of interactions with participants, rather than the number of unique participants. The following article outlines how to access the report, change report filters, view report sections, and how to save the report. This article also notes how report data is calculated.
Note: All data shown is example data, and not to be referenced as real data.
Change Report Filters
- By default, the Duplicate Contacts report is filtered to show data from records that you have created during the current reporting year. Both complete and incomplete records are included. Click the Filter button to change the default filters.

- Filter options display. Change the filter criteria as needed to display the desired set of data.

- Click Apply to confirm the selected filters. Each section now shows data based on the applied filters.

- The applied filters are listed under the title of the Duplicate Contacts report. For example, the Reporting Year, Curriculum, and Date range filters are displayed here:

View Report Sections
The Duplicate Contacts report includes a chart for each demographic category. Scroll down the page to see each section.
- Total
The total number of duplicated participants is listed at the top of the page. Demographics are reported for Program Activities that correspond to the selected filter criteria.
- Gender
The total duplicated gender of participants is reported for Program Activities that correspond to the selected filter criteria.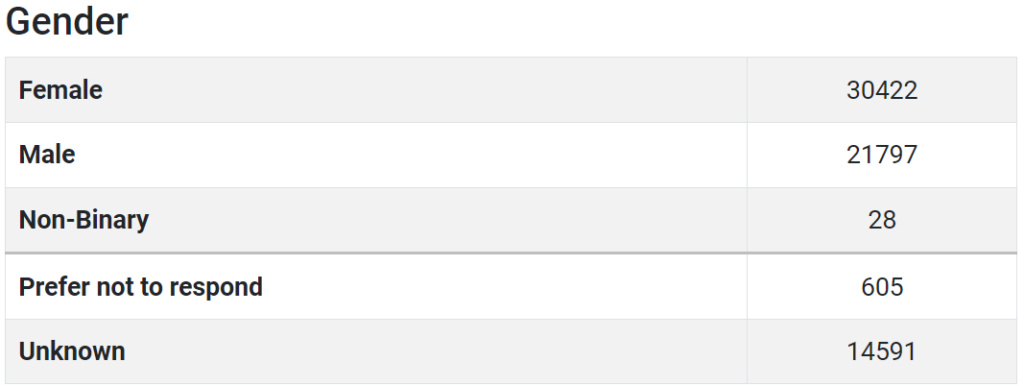
- Age
The total duplicated age of participants is reported for Program Activities that correspond to the selected filter criteria.
SNAP-Ed: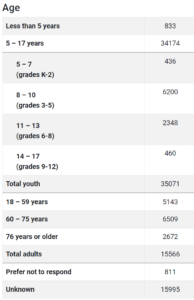
Extension: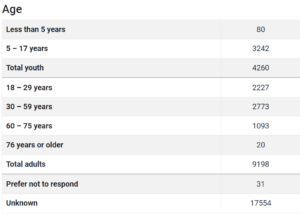
- Ethnicity
The total duplicated ethnicity of participants is reported for Program Activities that correspond to the selected filter criteria.
- Race
The total duplicated race of participants is reported for Program Activities that correspond to the selected filter criteria.
SNAP-Ed:
Extension:
Save Report Charts
To print or save this report, please reference the following article: Save or Print a Record as a PDF.
NOTE:
The program area filter only displays for organizations that use program areas. This includes Extension organizations and a few SNAP-Ed organizations. All other filters are available for all organizations.
NOTE:
The program area filter only displays for organizations that use program areas. This includes Extension organizations and a few SNAP-Ed organizations. All other filters are available for all organizations.
NOTE:
By default, all users only have access to view data that they have entered into PEARS. If you have been given permission to view all data in a specific unit or program area, this is noted above the number of total duplicate contacts. This note does not change based on filter criteria. All units and program areas that you have access to view will be listed, regardless of the filter criteria.
NOTE:
The number of participants and demographics are taken from the Program Activity Demographics page. The number of sessions is taken from the Program Activity General Information page. Only In person and Virtual, live online sessions are counted in this report. The session count does not include Virtual, self directed lessons.
NOTE:
To estimate the number of contacts, the following calculations are performed:
1. Find all Program Activities for the given filter criteria.
2. For each Program Activity, multiply the number of participants (and corresponding demographic information) by the number of sessions. The result is the total duplicate contacts for a single Program Activity.
3. Add the totals from step 2 for each Program Activity. The result is the total duplicate contacts for all Program Activities that meet the filter criteria.
4. The totals from step 3 are reported in the Duplicate Contacts report.
NOTE:
SNAP-Ed and Extension demographics are reported differently, in order to account for reporting requirements from different groups. For more details on the differences, see: Add Demographic Information to a Program Activity .
NOTE:
For Extension organizations, in years 2019 and after, the Age chart will display demographics for the 18-29 years and 30-59 years categories. For SNAP-Ed Data entered in 2022 or after, the 5-17 years age group will show sub-groups for 5-7, 8-10, 11-13, and 14-17 years. Additionally, SNAP-Ed data will group the 18-29 years and 30-59 years into one group of 18-59 years.
NOTE:
The program area filter only displays for organizations that use program areas. This includes Extension organizations and a few SNAP-Ed organizations. All other filters are available for all organizations.
