Location
This item is located in the Impact Dashboards Report, only in the SNAP-Ed Highlights.
Modules Included
This report item includes data from:
- PSE Site Activities
Filters
PEARS Applied Filters
The following filters are applied by PEARS behind the scenes:
- Test Data: Any data entered by a user marked as a Test User (usually PEARS team members) will not be included for normal users.
- Viewable by User: Only data that the logged in user (or creator of the dashboard share) can see will be displayed.
- Program Areas: For the SNAP-Ed Highlights dashboard, data is filtered to only include SNAP-Ed records initially.
User Available Filters
The following filter criteria can be applied by users:
- Reporting Periods
- Program Areas (Only for Organizations that use Program Area field)
- Users
- Units
- Sites
- Interventions (only for SNAP-Ed Highlights)
- Settings
- Complete
Calculations
The data points are calculated as follows for all data that fit the criteria above.
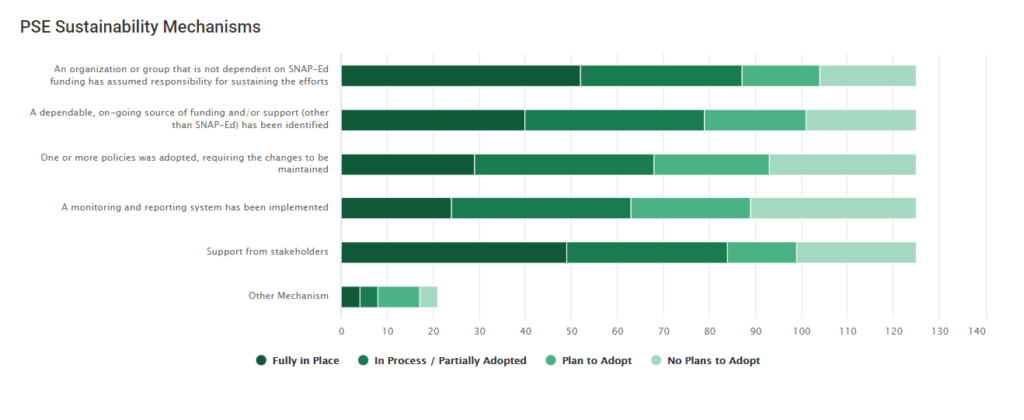
For each of the following sustainability mechanisms (collected in the Sustainability section), records are counted according to whether the mechanism is in place (Fully in Place, In Process / Partially Adopted, Plan to Adopt, No Plans to Adopt):
- An organization or group that is not depended on SNAP-Ed funding has assumed responsibility for sustaining the efforts
- A dependable, on-going source of funding and/or support (other than SNAP-Ed) has been identified
- One or more policies was adopted, requiring the changes to be maintained
- A monitoring and reporting system has been implemented
- Support from stakeholders
- Other Mechanism