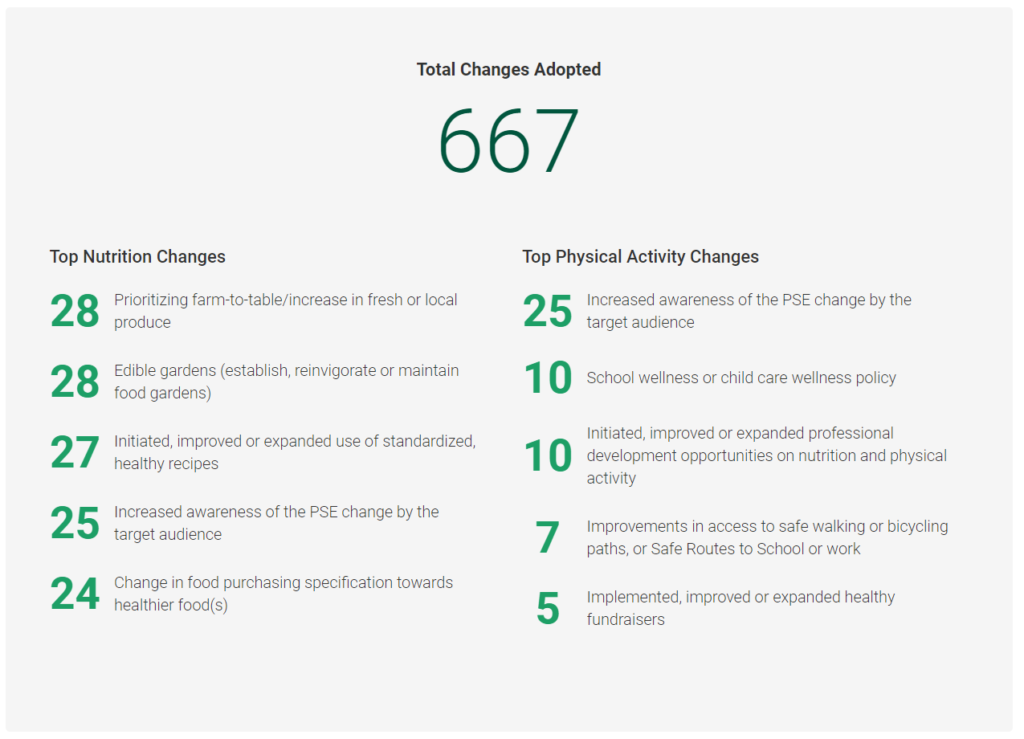
Location
This item is located in the Impact Dashboards Report, only in the SNAP-Ed Highlights.
Modules Included
This report item includes data from:
- PSE Site Activities
Filters
PEARS Applied Filters
The following filters are applied by PEARS behind the scenes:
- Test Data: Any data entered by a user marked as a Test User (usually PEARS team members) will not be included for normal users.
- Viewable by User: Only data that the logged in user (or creator of the dashboard share) can see will be displayed.
- Program Areas: For the SNAP-Ed Highlights dashboard, data is filtered to only include SNAP-Ed records initially.
User Available Filters
The following filter criteria can be applied by users:
- Reporting Periods
- Program Areas (Only for Organizations that use Program Area field)
- Users
- Units
- Sites
- Interventions (only for SNAP-Ed Highlights)
- Settings
- Complete
Calculations
The data points are calculated as follows for all data that fit the criteria above.
- All PSE Site Activities that fit the filter criteria and have Changes attached in the Changes Adopted section are grouped by change and counted (once per change attached).
- The total count of changes adopted is displayed at the top of the panel.
- The changes that are categorized as Nutrition changes are grouped and the top five changes adopted are listed on the left of the panel.
- The changes that are categorized as Physical Activity changes are grouped and the top five changes adopted are listed on the right of the panel.
Additional Notes
- As with all panels of the Impact Dashboards, if a dashboard is shared as a snapshot, the panel will show data exactly as it was at the time the share was created, according to the filters applied.
- Different changes may be listed for different reporting years, so the lists of changes may be very different when using the Reporting Periods filter.