What is the PEARS Census Dashboards page?
The Census Dashboard displays a summary of direct education reach data compared with data pulled from the American Community Survey.
How do I access the Census Dashboards?
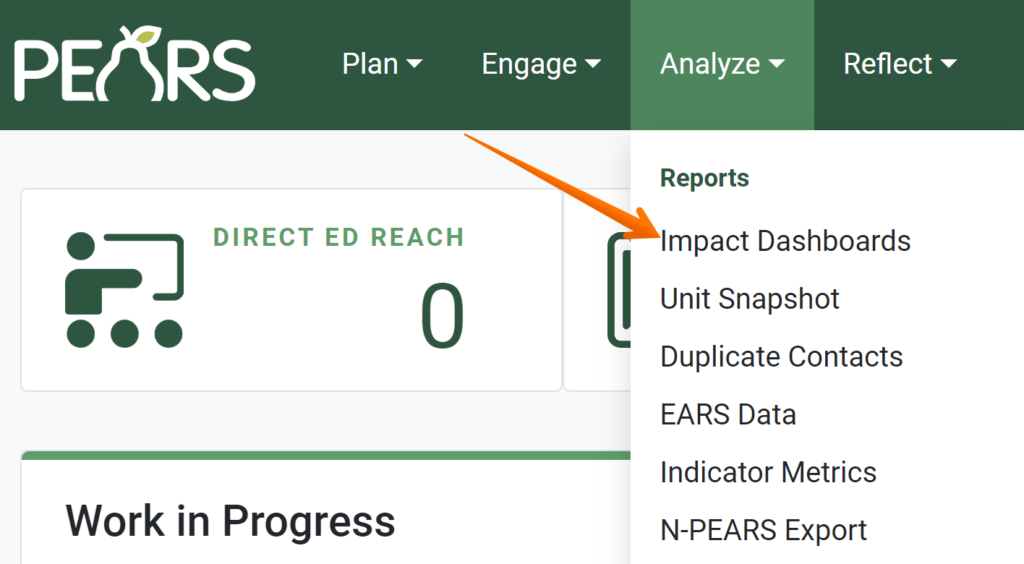
The Census Dashboards are located in the Impact Dashboards page in PEARS. To access the Impact Dashboards page, hover over the “Analyze” menu and click on “Impact Dashboards”.

Once the Impact Dashboards page loads, you have a list of possible dashboard categories to view. To view the Census Dashboards, click on the “Census Comparison” button.

Census Comparison Dashboard Content
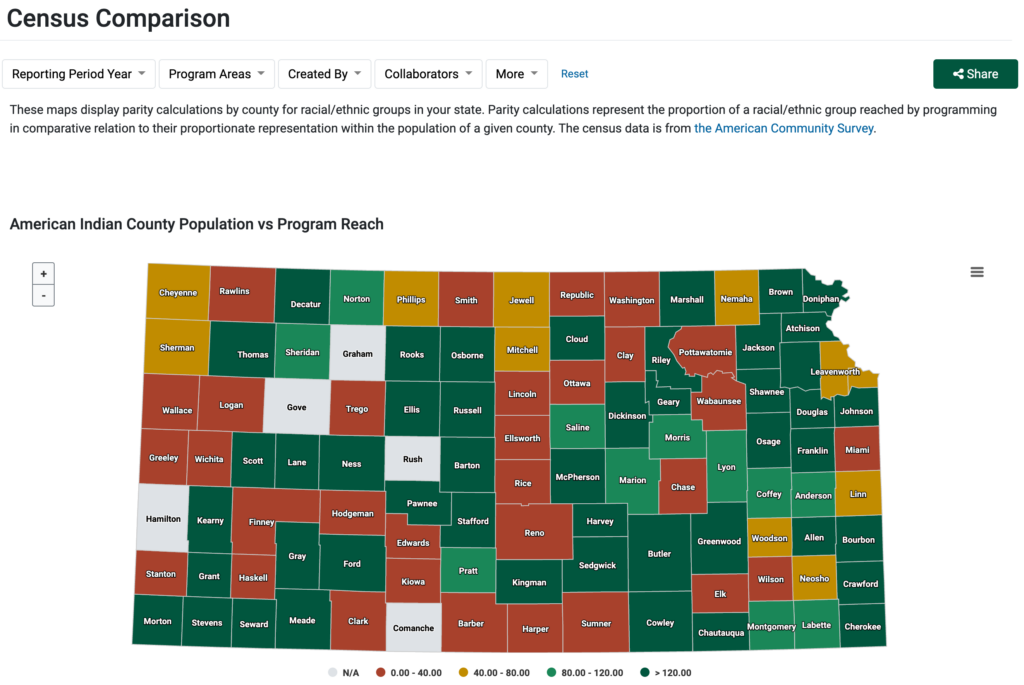
After clicking into the Census Comparison page, you will be presented with a series of maps. These maps compare your PEARS demographic reach data to the data that PEARS pulls from the Census Bureau’s API. The following is an example of one of the maps that will be present:

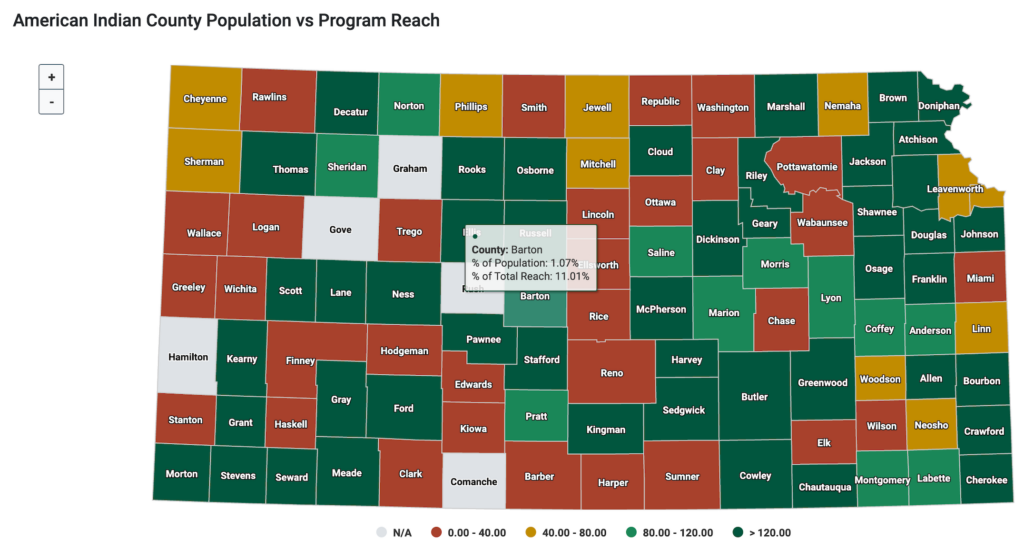
What you will see when the page loads is a geographical map of your state broken down by county. Take note of the box highlighted in red in the above image. When a user hovers over a specific county, a box with display which contains data both from PEARS and from the census. There are four rows of information in the box:
- A color that corresponds to the amount of over reach/under reach for the given demographic category.
- The name of the county being highlighted.
- The percent of the population the particular demographic category represented in the dashboard is of the overall population of that county.
- The percent of reach the demographic county is of your overall reach.

How is the Data Calculated?
The four items listed in the pop-up window are all calculated using census and PEARS data. The calculations are straightforward. The key concept to bear in mind is that each of the dashboards are broken down by racial category. So, for example, the “American Indian County Population vs. Program Reach” map pulls the census data of the American Indian population by county. Using that data, a series of calculations care conducted.
Color: The small dot at the top of the window mirrors the color of the county that is being hovered over. The color applied signifies the degree to which there is either over or under reach of the demographic category in the dashboard. The color-coding categories are listed at the bottom of the dashboard map:
 The calculation to arrive at the categorization of a county involves summing all the program activity participants in the county (based on the filters that have been applied as well as the permissions of the user in the dashboards) and dividing the number by the total number of residents in the county who match the demographic category of the dashboard being used (a number that is pulled from the Census API).The quotient of that calculation is the percent of program activity reach in that county of the demographic population of the dashboard
County: The county listed is the one that is currently being hovered over with the mouse cursor.
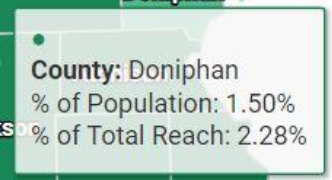
% of Population: This field describes what percent of the overall population of the selected county that the dashboard’s demographic category constitutes. Using the example of Doniphan county, this particular demographic category is 1.5% of the overall population of the county:
% of Total Reach: This percentage is calculated by pulling two data points. First, the amount of reported program activity unique contacts of the category corresponding to the demographic category of the dashboard that you have access to view. Secondly, the total reach of all program activities in the selected county. The percentage displayed is a results of the quotient of diving the first data point (unique reach) by the second (percent of overall unique reach in the county). So, for example, if there had been 50 program activity contacts with American Indians in a certain county, and 200 contacts overall, the % of Total Reach would read as 25.00%.
"How could I have more than 100% reach of a demographic category?"
If an individual participated in multiple program activities, they would be counted twice in this comparison. Several instances of that occurring could cause the total programmatic reach of the demographic category in question to list as greater than 100%. Essentially, individuals can be counted multiple times if the attend multiple program activities.
✓ TIP:
If you’ve used the impact dashboard before, the Census dashboards are located on the same page. If you are thinking of using any of the dashboards on a regular basis, consider creating a bookmark in your browser for the dashboards page.
NOTE:
Note that not all of the buttons displayed here will appear for every implementing agency. For example, SNAP-Ed only implementing agencies will not see the Extension dashboard option.
NOTE:
As in the other impact dashboards, the PEARS data that displays in the Census Comparison dashboard is only the data that you have permission to see. By default, users only have permission to see PEARS records that they have created.
NOTE:
Customizing the applied filters to the data in the Census Comparison
dashboard offers a great way to view data in various contexts. For example, do you want to compare census data to an individual user’s data? Add that user’s name to the “Created by” filter field.
