Location
This item is located in the Impact Dashboards Report, User Dashboard.
Modules Included
This report item includes data from:
- Program Activities
Filters
PEARS Applied Filters
The following filters are applied by PEARS behind the scenes:
- Test Data: Any data entered by a user marked as a Test User (usually PEARS team members) will not be included for normal users.
- Viewable by User: Only data that the logged in user (or creator of the dashboard share) can see will be displayed.
User Available Filters
The following filter criteria can be applied by users:
- Reporting Period Year
- Program Area (Only for Organizations that use Program Area field)
- Created By
- Collaborator
- Contributed to by Collaborator
- Completion Status
Calculations
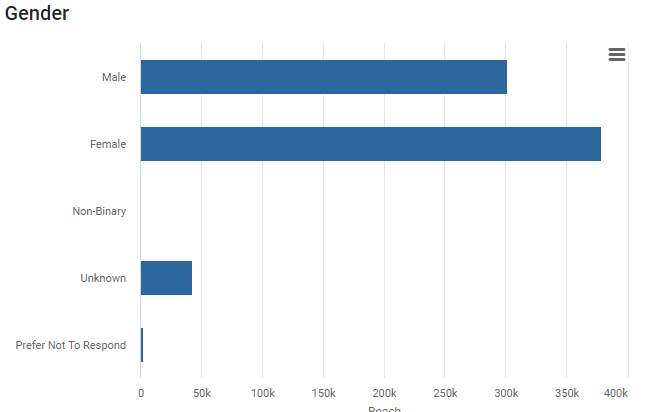
The data points are calculated as follows for all data that fit the criteria above.
The demographics of each program activity that fit the filter criteria are summed up by the following categories, then displayed in a bar chart.
- Male
- Female
- Non-Binary
- Unknown
- Prefer Not to Respond