Location
This item is located in the Impact Dashboards Report, User Dashboard
Modules Included
This report item includes data from:
- Program Activities
Filters
PEARS Applied Filters
The following filters are applied by PEARS behind the scenes:
- Test Data: Any data entered by a user marked as a Test User (usually PEARS team members) will not be included for normal users.
- Viewable by User: Only data that the logged in user (or creator of the dashboard share) can see will be displayed.
User Available Filters
The following filter criteria can be applied by users:
- Reporting Period Year
- Program Area (Only for Organizations that use Program Area field)
- Created By
- Collaborator
- Contributed to by Collaborator
- Completion Status
Calculations
The data points are calculated as follows for all data that fit the criteria above.
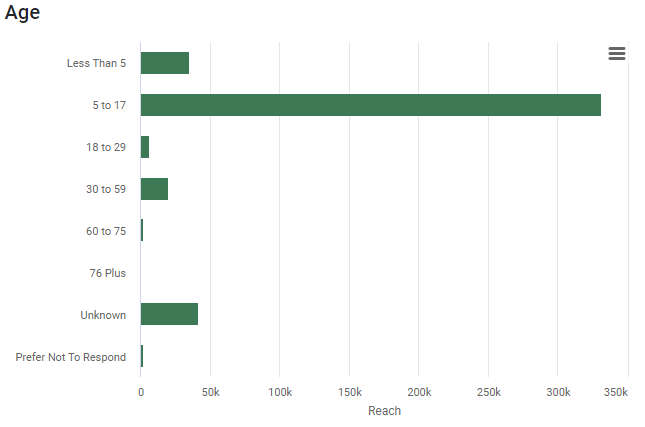
The demographics of each program activity that fit the filter criteria are summed up by the following categories, then displayed in a bar chart.
- Less than 5 years old
- 5-17 years old
- 18-59 years old – If the panel is displayed on the Extension Highlights dashboard, this group will be split into 18-29 years old and 30-59 years old if any data for those categories exist
- 60 years or older
- Unknown
- Prefer Not to Respond
A breakdown of the sum for each category is available when hovering over a section of the bar chart.
Additional Notes
- As with all panels of the Impact Dashboards, if a dashboard is shared as a snapshot, the panel will show data exactly as it was at the time the share was created, according to the filters applied.
- At this time, demographics recorded as only “Adult” or “Youth” are not displayed in this panel.
