Location
This item is located in the Impact Dashboards Report, SNAP-Ed Highlights.
Modules Included
This report item includes data from:
- Program Activities
Filters
PEARS Applied Filters
The following filters are applied by PEARS behind the scenes:
- Test Data: Any data entered by a user marked as a Test User (usually PEARS team members) will not be included for normal users.
- Viewable by User: Only data that the logged in user (or creator of the dashboard share) can see will be displayed.
- Program Areas: For the SNAP-Ed Highlights dashboard, data is filtered to only include SNAP-Ed records initially.
User Available Filters
The following filter criteria can be applied by users:
- Reporting Period Year
- Program Areas (Only for Organizations that use Program Area field)
- Created By
- Collaborators
- Contributed by Collaborator
- Primary Curriculum (only for SNAP-Ed Highlights)
- Unit
- Site
- Action Plans (only for Extension Highlights)
- Setting (only for Extension Highlights)
- Interventions (only for SNAP-Ed Highlights)
- Completion Status
Calculations
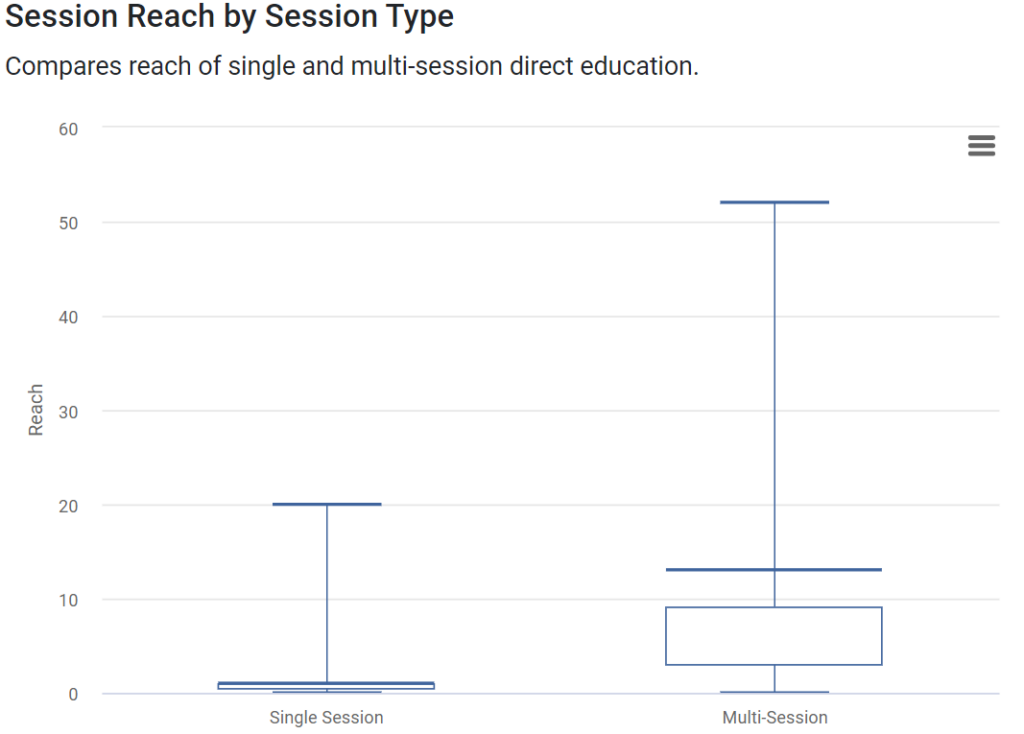
The data points are calculated as follows for all data that fits the criteria above to form a box chart.
Total reach is counted and classified according to five data points.
Each point is shown on the chart by a horizontal line. Starting at the bottom: minimum, first quartile, median, third quartile, and maximum.
The enclosed box shows combines the second and third quartiles.
Then they are plotted against the number of sessions used to record the reach.
Additional Notes
As with all panels of the Impact Dashboards, if a dashboard is shared as a snapshot, the panel will show data exactly as it was at the time the share was created, according to the filters applied.
