Activities by City

All data shown is example data, and not to be referenced as real data.

Location

This item is located in the Impact Dashboards Report, in both the Extension and SNAP-Ed Highlights.

Modules Included

This report item includes data from:
  • Program Activities
  • Indirect Activities
  • PSE Site Activities

Filters

PEARS Applied Filters

The following filters are applied by PEARS behind the scenes:
  • Test Data: Any data entered by a user marked as a Test User (usually PEARS team members) will not be included for normal users.
  • Viewable by User: Only data that the logged in user (or creator of the dashboard share) can see will be displayed.
  • Indirect Activities: Only Indirect Activities with one or more intervention channels that have a site are displayed.
  • Program Areas: For the SNAP-Ed Highlights dashboard, data is filtered to only include SNAP-Ed records initially.

User Available Filters

The following filter criteria can be applied by users:
  • Reporting Period Year
  • Program Areas (Only for Organizations that use Program Area field)
  • Created By
  • Collaborators
  • Contributed by Collaborator
  • Primary Curriculum (only for SNAP-Ed Highlights)
  • Unit
  • Site
  • Action Plans (only for Extension Highlights)
  • Setting (only for Extension Highlights)
  • Interventions (only for SNAP-Ed Highlights)
  • Completion Status

Calculations

The data points are calculated as follows for all data that fit the criteria above.
Program activities are grouped together by the city of the attached site and counted.
Indirect activities are grouped together by the city of the site(s) attached to intervention channels and counted.
An indirect activity with multiple intervention channels in the same city will be counted once per channel per city.
PSE site activities are grouped together by the city of the attached site and counted.
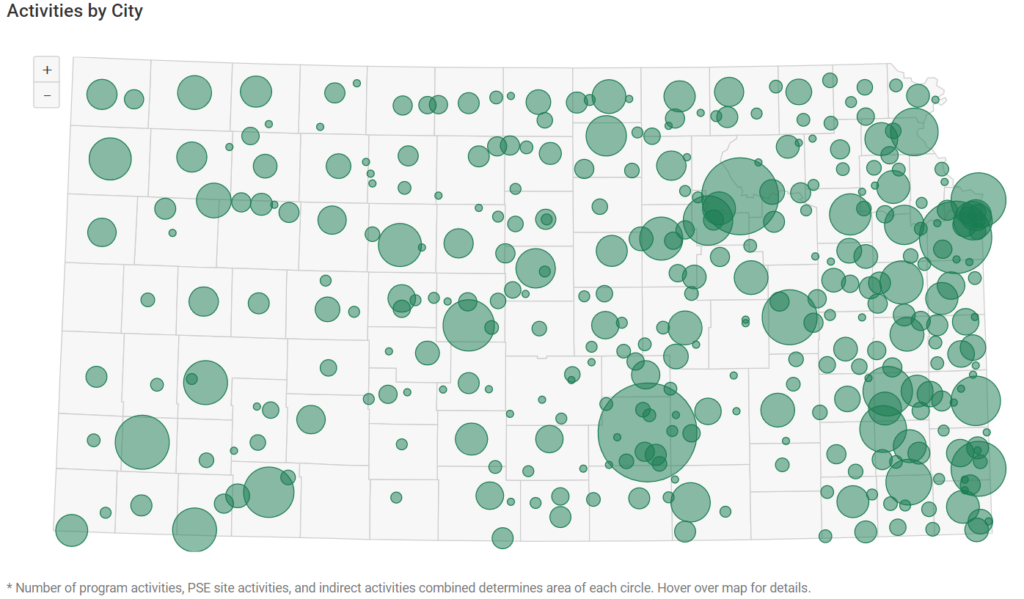
The counts of each module are added together for a total count of activities per city, then displayed as circles over each city (sized proportionally by the number of activities).
Counts of each module as well as the total can be viewed when hovering the mouse over a specific city.

Additional Notes

As with all panels of the Impact Dashboards, if a dashboard is shared as a snapshot, the panel will show data exactly as it was at the time the share was created, according to the filters applied.
 
Click to see more options: View in full screen, print chart, download chart in various formats, or view the data table.
       Hovering over the panel will give a breakdown of the data along with helpful details.