Summary
In July 2023, we released a new version of the Homepage Dashboard. The new dashboard better highlights work in progress, with a goal for all users to complete their records before the reporting period deadline. New components of the homepage dashboard include:
- Work in Progress
- Completion Status by Module
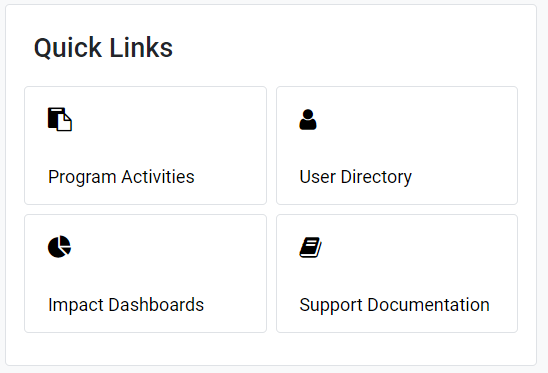
- Quick Links
- Events and Deadlines
- Reach and Responses
- Notifications
Users could “opt in” to using this new dashboard from July 2023 – May 2024.
Starting June 13, 2024 all users will see the new dashboard by default. Users can opt out of the new dashboard within their user profile settings (see instructions below.) The old homepage view will receive no future updates, and will be gradually phased out. Please let our support team know if you have any questions.
Please see the sections below for details about each change.
Components
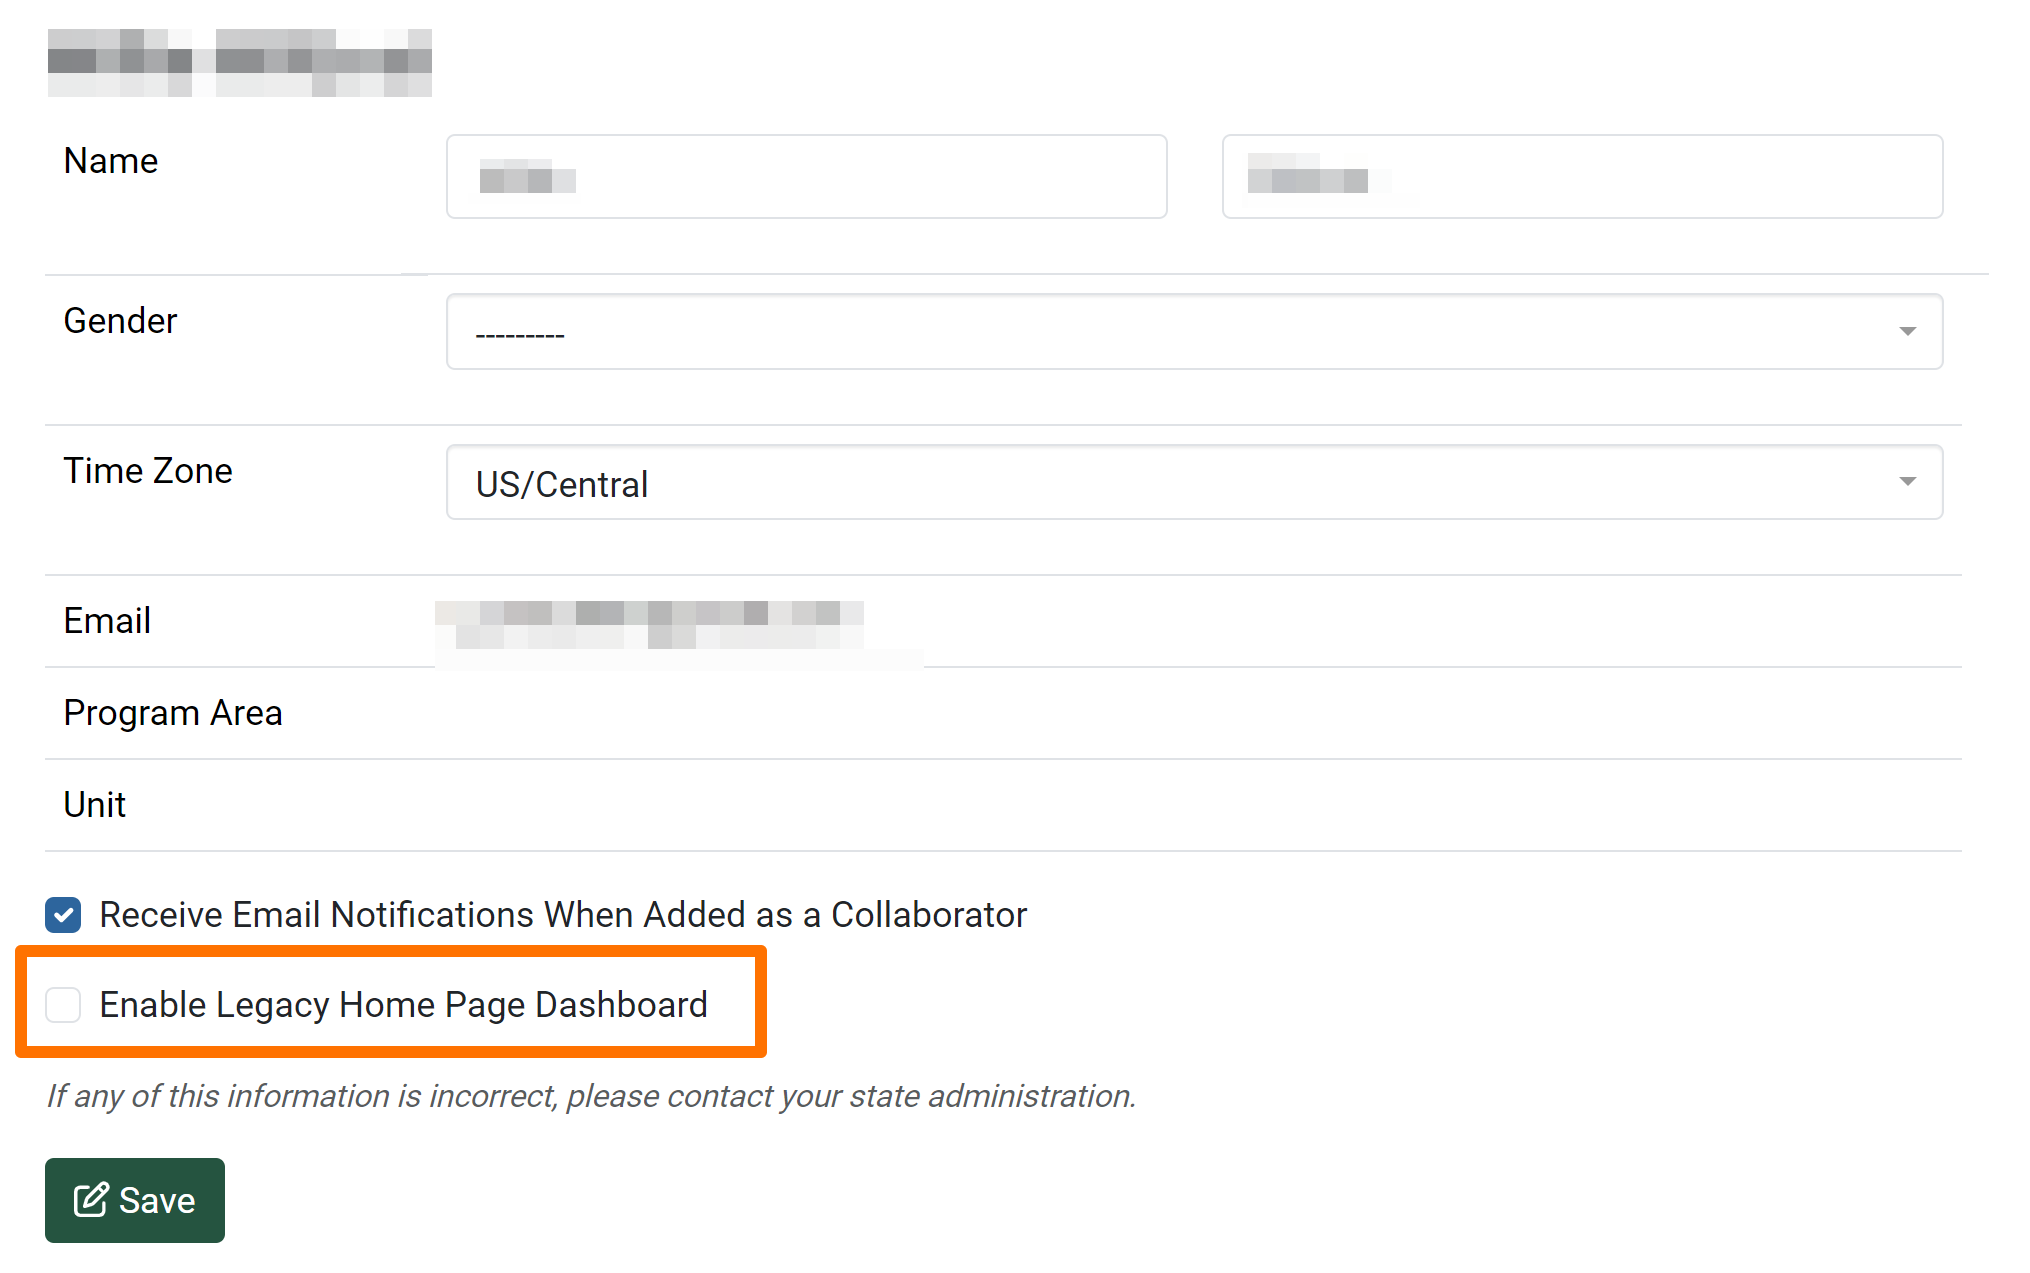
Each user is able to switch back to the “legacy” version of the dashboard in their Manage Account screen. Currently, users have the option to revert back to the legacy version of the dashboard, as we move towards the new dashboard becoming more permanent.
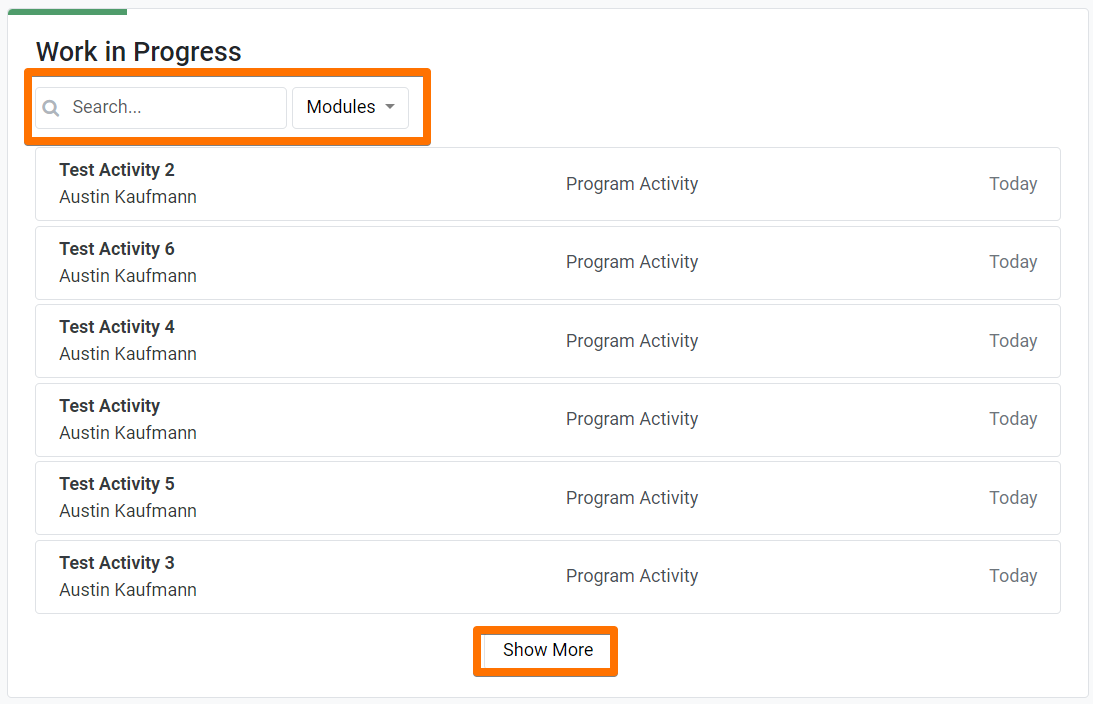
The records sort automatically by module and then by date modified. This panel features the ability to search for records and filter by modules. If you have more than 6 records, a Show More button will be visible. If you click show more, it will increase by another 6, until all records are shown. To return back to the 6 record view, click Show Less. Clicking on a record in this panel will take you its detail view. If you complete all of the records in progress, you will see a “Congratulations all work has been completed” screen.
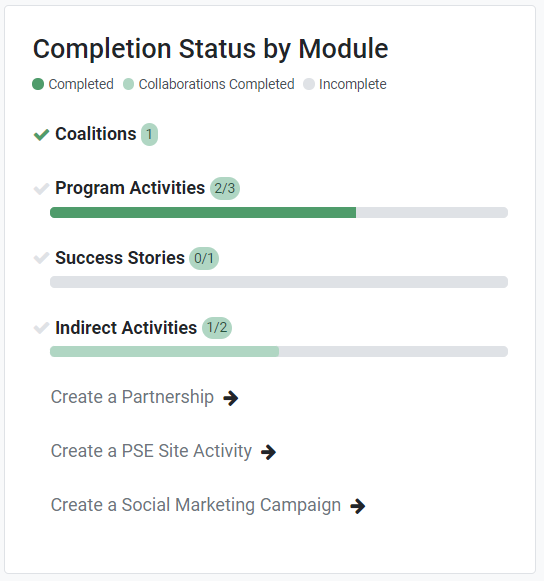
This panel tracks your completion across different modules. Before any records are completed, links are offered to create a record. There is a bubble that shows the completed records over the total created. The progress bar shows the same ratio, and it uses the three colors to differentiate record types. Dark green shows completion of your own record, light green shows completion of a record you collaborated on, and grey shows all incomplete records. Once you have completed a record and have none other in progress for a given module, the progress bar will disappear and you will see a dark green check mark to the left of the module. The bubble will show the total count of completed records within the module.
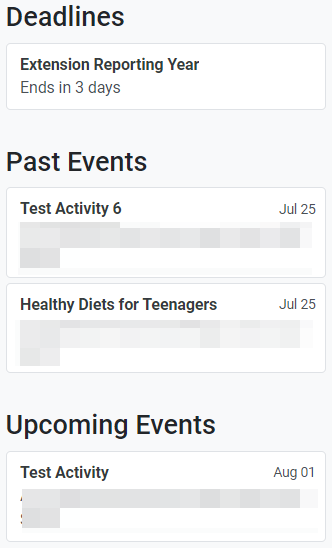 There are three sections on the page labeled Deadlines, Past Events, and Upcoming Events.
Deadlines show when your Close Datetime is within 14 days. When you hover over the deadline you can see the date of the deadline.
Past Events show events from the previous month and are linked. You can access the record by clicking in the box.
Upcoming Events show events that are going to occur in the next 3 months. You can access the record by clicking in the box.

There are three boxes at the top of the dashboard that give a running total of your Direct Ed Reach, Indirect Ed Reach, and Survey Responses.
Direct Ed Reach shows a count of all of your program activities combined, both complete and incomplete for the current reporting period.
Indirect Ed Reach shows a count of all of your indirect activities combined, both complete and incomplete for the current reporting period.
Survey Responses shows the total number of all your survey responses for the current reporting period.
