Location
This item is located in the Impact Dashboards Report, in both the Extension and SNAP-Ed Highlights.
Modules Included
This report item includes data from:
- Partnerships
- Coalitions
Filters
PEARS Applied Filters
The following filters are applied by PEARS behind the scenes:
- Test Data: Any data entered by a user marked as a Test User (usually PEARS team members) will not be included for normal users.
- Viewable by User: Only data that the logged in user (or creator of the dashboard share) can see will be displayed.
- Program Areas: For the SNAP-Ed Highlights dashboard, data is filtered to only include SNAP-Ed records initially.
User Available Filters
The following filter criteria can be applied by users:
- Reporting Periods
- Program Areas (Only for Organizations that use Program Area field)
- Users
- Units
- Sites
- Sites are an optional field for coalition members. Coalitions that have no sites attached to any coalition members will not be included.
- Action Plans (only for Extension Highlights)
- Settings
- This filter is applied to the setting attached to the site of the partner or coalition member. Sites without a setting specified will be excluded.
- Complete
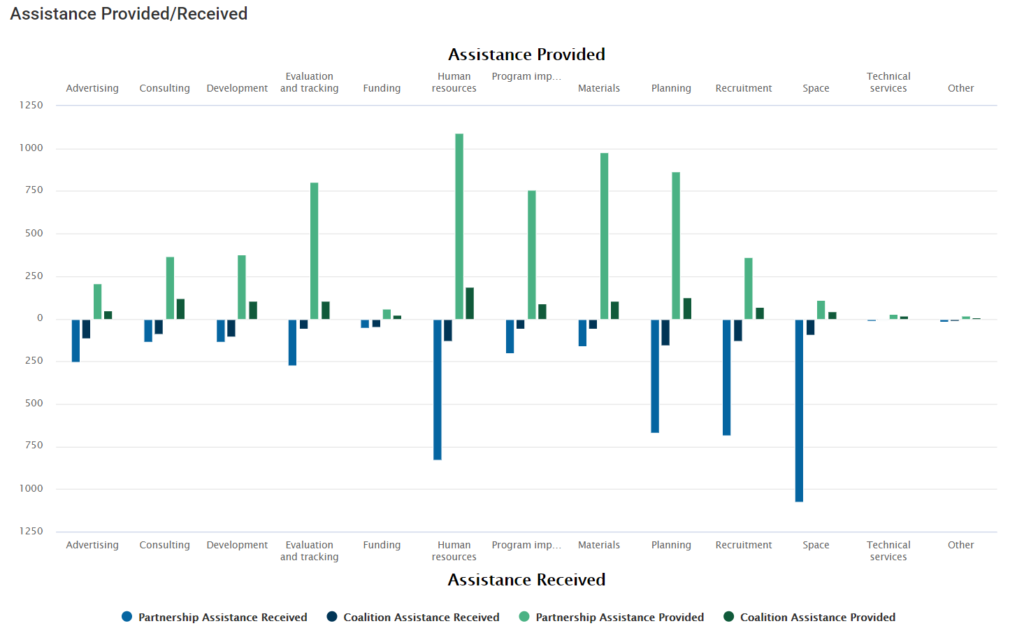
Calculations
The data points are calculated as follows for all data that fit the criteria above.
- Partnerships are grouped together by “Assistance Provided” and counted. Each partnership will be counted once for each Assistance Type provided.
- Partnerships are grouped together by “Assistance Received” and counted. Each partnership will be counted once for each Assistance Type received.
- Coalitions are grouped together by “Assistance Provided” and counted. Each coalition will be counted once for each Assistance Type provided.
- Coalitions are grouped together by “Assistance Received” and counted. Each partnership will be counted once for each Assistance Type received.
- The four counts are displayed within a split column chart (Assistance Provided on top, Assistance Received on bottom).
- The count for each module/assistance combination will be displayed when hovering the mouse over a specific column.